Dagster basics tutorial
In this tutorial, you will learn about core Dagster features and use them to build a working data pipeline. We will start with the fundamental concepts and progress to higher level abstractions that showcase the power of Dagster.
By the end, you will be ready to build your own data pipelines and explore more advanced features and integrations.
Dagster's programming model
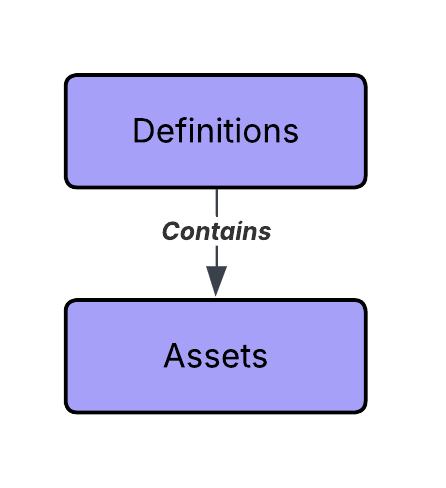
Dagster’s programming model is built around Assets, which are organized within Definitions.
-
Definitionsact as containers for all Dagster entities in your project. -
Assetsare the core building blocks of Dagster. They represent the entities in your data platform, while the dependencies between them define the project’s lineage.
If you’d like to learn about the full set of Dagster features and how they interact with each other, check out our Concepts page.
Prerequisites
To follow the steps in this tutorial, you'll need:
- Python 3.10+ and a Python package manager. For more information, see the Installation guide.
- Familiarity with Python and SQL.
- A basic understanding of data pipelines.
You are now ready to starting building with Dagster.