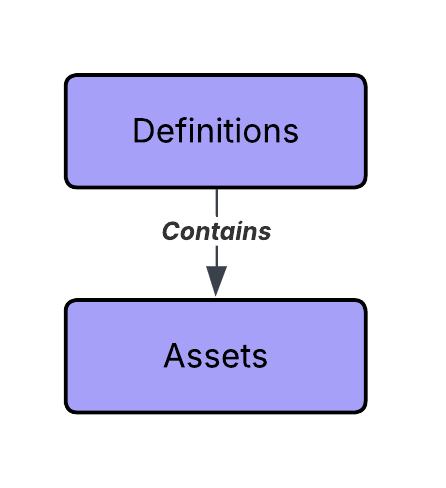
Now that you've installed Dagster and know what assets are, it's time for you to build parts of your first data pipeline!
In this tutorial, you'll analyze activity on a popular news aggregation website called Hacker News. This website features user-submitted stories about technology and startups. You will fetch data from the website, clean it up, and build a report summarizing your findings.
In Dagster, the main way to create data pipelines is by writing assets. By the end of this tutorial section, you'll have written your first asset.
The scaffolded Dagster project has a directory called tutorial. If you named your project differently when running the Dagster CLI, the directory will be named after that.
The tutorial directory has a file named assets.py. This is where you'll put your first data pipeline.
This code creates a list of integers representing the IDs for the current top stories on Hacker News and stores them in a file called data/topstory_ids.json.
Next, you will work towards making this code into an asset definition. The first step is turning it into a function:
import json
import os
import requests
deftopstory_ids()->None:# turn it into a function
newstories_url ="https://hacker-news.firebaseio.com/v0/topstories.json"
top_new_story_ids = requests.get(newstories_url).json()[:100]
os.makedirs("data", exist_ok=True)withopen("data/topstory_ids.json","w")as f:
json.dump(top_new_story_ids, f)
Now, add the @asset decorator from the dagster library to the function:
import json
import os
import requests
from dagster import asset # import the `dagster` library@asset# add the asset decorator to tell Dagster this is an assetdeftopstory_ids()->None:
newstories_url ="https://hacker-news.firebaseio.com/v0/topstories.json"
top_new_story_ids = requests.get(newstories_url).json()[:100]
os.makedirs("data", exist_ok=True)withopen("data/topstory_ids.json","w")as f:
json.dump(top_new_story_ids, f)
That's all it takes to get started 🎉. Dagster now knows that this is an asset. In future sections, you'll see how you can add metadata, schedule when to refresh the asset, and more.
And now you're done! Time to go into the Dagster UI and see what you've built.
Using Dagster's UI, you can explore your data assets, manually launch runs, and observe what's happening during pipeline runs.
As a reminder, to launch the UI, set your terminal's current directory to /tutorial and run the following command:
dagster dev
Navigate to localhost:3000 in your browser to see the Dagster UI.
You should see a screen that looks similar to below. If you do not see it, go the top navigation bar, click on Assets, then go the top-right region and click on View global asset lineage. You can also navigate directly to this page by going to localhost:3000/asset-groups. As more assets are built, this graph will show your entire data platform in one place. This page can also be referred to as the Global Asset Lineage.
Observe that Dagster has detected your topstory_ids asset, but it says that the asset has never been “materialized”.
To materialize an asset means to create or update it. Dagster materializes assets by executing the asset's function or triggering an integration.
To manually materialize an asset in the UI, click the Materialize button in the upper right corner of the screen. This will create a Dagster run that will materialize your assets.
To follow the progress of the materialization and monitor the logs, each run has a dedicated page. To find the page:
Click on the Runs tab in the upper navigation bar
Click the value in the Run ID column on the table of the Runs page
The top section displays the progress, and the bottom section live updates with the logs
You've written the first step in your data pipeline! In the next section, you'll learn how to add more assets to your pipeline. You'll also learn how to add information and metadata to your assets.