Troubleshooting sensor timeouts
In this guide, we’ll discuss how to handle sensors that time out.
All suggestions in this guide apply to both Dagster Open Source (OSS) and Dagster+, unless specifically stated.
The default sensor timeout is 60 seconds, and sensors can hit that limit for a number of reasons. Most of the time, timeouts are the result of poorly optimized business logic or network issues, but occasionally, the business logic does require long evaluation cycles.
For these cases, we provide a mechanism to increase the default timeout of sensors, in both OSS and Dagster+. However, we consider changing the sensor timeout to be a last resort; we recommend considering the other options in this guide before attempting to change the timeout.
Step 1: Find the root of the timeout
The first step of addressing sensor timeouts is to understand why they are occurring. To do this, we recommend using py-spy, which allows you to profile your business logic and understand where the hot paths are. For more information on using py-spy, see Profiling your code with py-spy.
Often, hot paths can manifest as calls to external APIs hanging or poorly optimized business logic. In the case of hanging external API calls, timing out is the appropriate failure mode. You may even consider making the sensor timeout shorter to improve resilience to these types of transient API errors.
Step 2: Break up sensor evaluations
If, after understanding the hot paths to your code, you don’t have external hanging API calls and there’s no clear place for optimization, the next step is to consider breaking up the expensive sensor evaluations into multiple steps using sensor cursors. For more information, see the sensor cursors documentation.
Step 3: Use schedules for longer evaluations
The above advice is well and good if evaluations take slightly over 60 seconds, but it’s possible sensor evaluations need to take longer. Generally, if evaluations require more than 3 minutes to complete, a sensor may not be the correct tool for your needs.
Sensors are best used for frequently evaluating small amounts of data to kick off real work down the line. But if your sensors are running beyond the expected limit, then a scheduled job which sends run requests to engage in other work is more suited to your task. For more information, see the Schedules documentation.
Step 4: Increase the sensor timeout
At this point in the guide, you should have identified that:
- Your sensor is timing out, but doesn’t need to run for over 3 minutes
- There are no obvious opportunities for code optimization
- Breaking up the sensor evaluation is not enough for you, or does not work for your use case
In this case, it's time to consider increasing the sensor timeout.
Dagster Open Source (OSS)
In Dagster OSS, the timeout can be increased using the DAGSTER_SENSOR_GRPC_TIMEOUT_SECONDS environment variable. In OSS, the Dagster daemon sends requests directly to the user code servers. In both the daemon and code servers, the following can all be bottlenecks:
- CPU
- Memory
- Maximum request throughput
The number of workers available on the code server can be configured using the DAGSTER_GRPC_MAX_WORKERS environment variable. The number of workers available to the sensor daemon can be configured in the dagster.yaml sensor settings:
sensors:
  use_threads: true
  num_workers: 8
Dagster+
The sensor timeout can be changed as a deployment setting: default_sensor_timeout. To configure deployment settings, see the full deployment settings reference.
Set the default_sensor_timeout to the number of seconds that you wish your sensors to time out at. Note that this will affect all sensors in your deployment, including sensors added after this change.
Hybrid deployments
Hybrid deployments have a few additional options and considerations.
When you increase the timeout of your sensors, you are potentially placing more load on your user code deployment. In Hybrid deployments, it's important to be aware of the health of your system and the mitigations available to you if increasing the timeout leads to any instability.
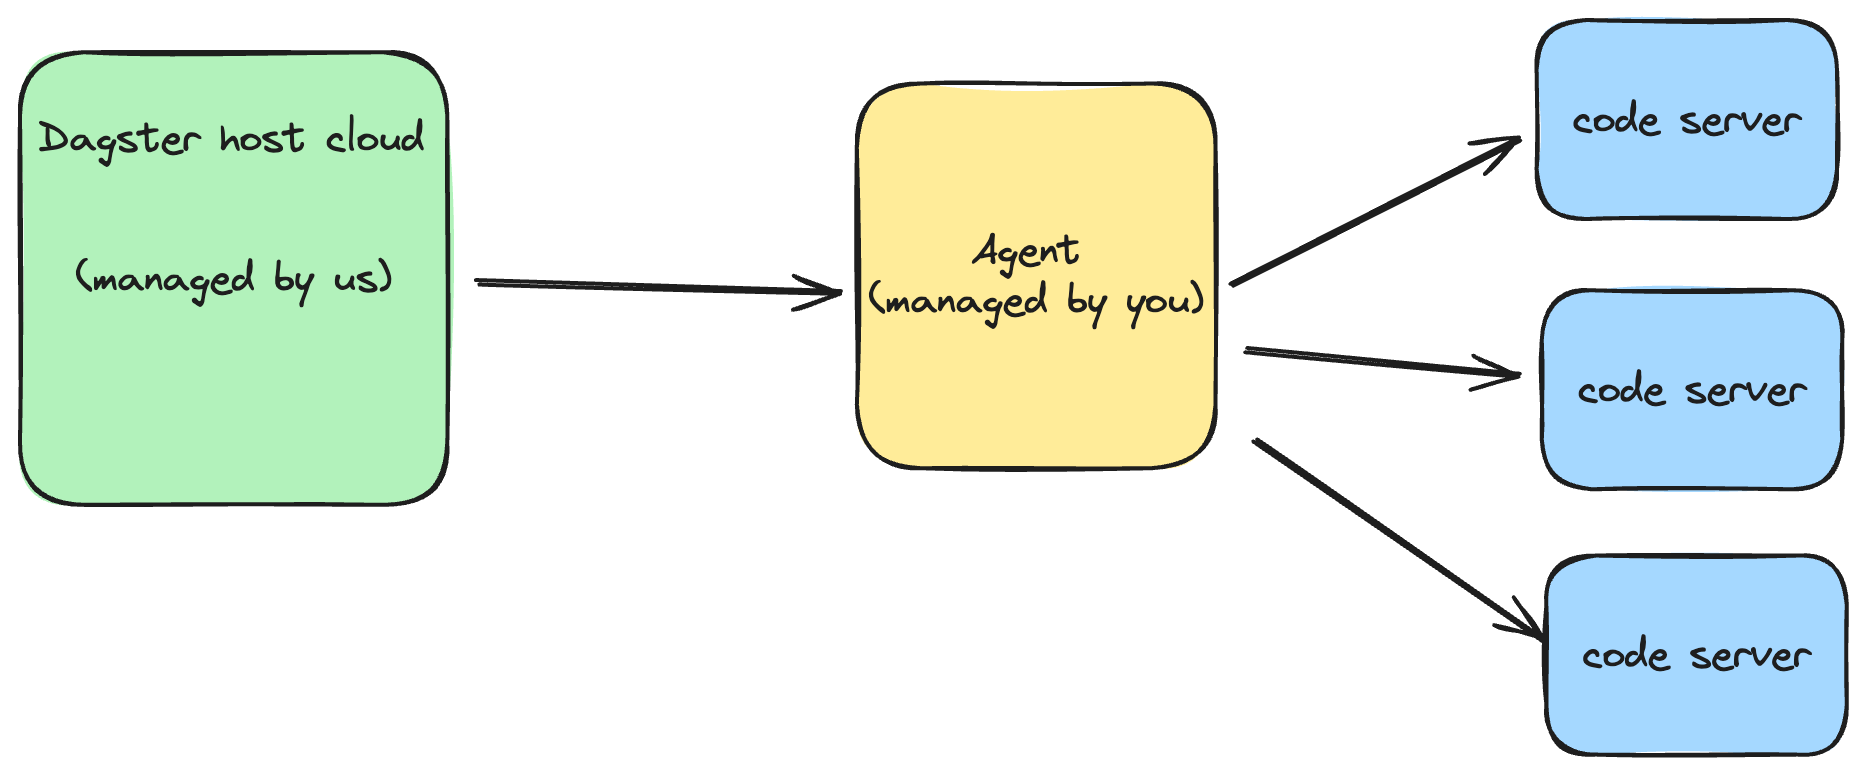
The above diagram describes how sensor requests flow through the system. They are generated in Dagster's host cloud, then sent to the agent, which sends requests to the code server running a particular sensor.
As sensor throughput increases, there's the potential for bottlenecks anywhere in this flow. Each bottleneck is limited by three things:
- The maximum concurrent requests that can be handled by the system component
- The CPU limits of the component
- The memory limits of the component
Bumping up against (1) or (2) usually manifests as increased lag times between sensor runs. Bumping up against (3) can lead to the underlying container being killed and restarted.
Monitoring the CPU and memory of the agent and code servers should be done using the underlying deployment service (Kubernetes, ECS, etc), but is out of the scope of this guide. If you find that increasing the sensor timeout leads to issues, necessary action to increase your resource limits should be taken:
- For k8s, see Resource management for pods and containers in the Kubernetes documentation.
- For ECS, we provide
AgentMemory,AgentCpu,CodeServerMemory, andCodeServerCPUparameters on our CloudFormation agent template that allow you to easily configure your resource constraints. - For general Dagster+ Hybrid performance troubleshooting, see Dagster+ Hybrid performance optimization and troubleshooting.
Exposing agent and code server metrics in Dagster+ Hybrid
Let's turn our attention to handling the maximum request throughput of the agent/code server. With dagster >= 1.6.4, you can enable logging that exposes the current throughput of your agent and/or code server.
It is important to make sure that both your agent and your code server versions are running 1.6.4 or greater. The metrics collection feature is not backwards compatible with older versions of Dagster, and you could run into errors if both are not upgraded.
To check the version of an agent:
- In the left sidebar, click the Deployment tab.
- In the main window, click the Agents tab.
- Under the "Labels" header, you should see a number
v1.x.x.This is the Dagster version of your agent.
To check the version of a code server:
- In the left sidebar, click the Deployment tab.
- In the main window, click the Code locations tab.
- Under the "Actions" header, there is a dropdown menu, one for each code location. Click this dropdown menu, then select "View dagster libraries".
- The
Versionnext todagsteris the version of your code server.
After verifying your agent and code server versions meet the requirements, you can enable throughput logging:
- K8s: Add the following values to your Helm chart at the top level:
agentMetrics:
  enabled: true
codeServerMetrics:
enabled: true - ECS: Set the
AgentMetricsEnabledandCodeServerMetricsEnabledsettings totrue. - Docker: This functionality isn’t currently supported.
Once enabled, you should see metrics tracking the throughput of the agent in your agent logs. This includes not only the agent’s maximum throughput, but also each code server. In both cases, the request utilization metrics are provided in a JSON blob.
For the agent, the log looks like this:
dagster_cloud_agent - Current agent threadpool utilization: 0/20 threads
For the code server, the request utilization information must be parsed out of a larger JSON blob of information:
> user_code_launcher - Updated code server metrics for location sensor_test_87 in deployment prod: {'container_utilization': {'num_allocated_cores': 2, 'cpu_usage': 320.930756512, 'cpu_cfs_quota_us': -1.0, 'cpu_cfs_period_us': 100000.0, 'memory_usage': 150790144, 'memory_limit': 9223372036854771712, 'measurement_timestamp': 1708649283.031707, 'previous_cpu_usage': 320.823456119, 'previous_measurement_timestamp': 1708649221.99951}, 'request_utilization': {'max_concurrent_requests': 50, 'num_running_requests': 1, 'num_queued_requests': 0}, 'per_api_metrics': {'Ping': {'current_request_count': 1}}}
In the above code example, there are many fields that can be ignored. The important fields from the perspective of request throughput are:
num_running_requests: tracks the number of currently running requests on the code servernum_queued_requests: tracks number of enqueued requests on the code server (not currently running).max_concurrent_requests: the maximum number of requests which can run at any given time on the code server.
Increasing the agent’s maximum concurrent requests
It may turn out that you are reaching utilization for the number of requests your agent can serve. The default number of workers is dependent upon the number of cores available to your container. This number can be increased using the DAGSTER_CLOUD_AGENT_MAX_THREADPOOL_WORKERS environment variable. This should be set on the container running the agent itself.
Increasing the maximum concurrent requests for the code server
The default number of workers is dependent upon the number of cores available to your container. However, the number of concurrent requests can also be increased for code servers. This can be done with the DAGSTER_GRPC_MAX_WORKERS environment variable being set on startup in the container running the code server.