Debugging assets during execution
Sometimes you may want to debug an asset while it is executing. To simplify this process, Dagster supports interactive debugging with pdb through the AssetExecutionContext of an asset. pdb helps you identify and fix bugs by enabling you to inspect variables and program flow in an interactive debugging console starting from a breakpoint you set in your code.
This can be useful when debugging assets with complex transformations or assets that retrieve data from external systems where you want to work directly with the data inside of the asset.
To follow the steps in this guide, you'll need to create a Dagster project with the create-dagster CLI.
Step 1: Set a pdb breakpoint in your asset
First, add the context parameter to your asset definition, and add context.pdb.set_trace() to the asset code where you want to add a breakpoint. You should insert your breakpoint after the variables you are interested in have been initialized but before any mutations. With pdb you will be able to proceed to the next statement of the asset but will not be able to reverse the state of a variable so it is better to set the break point early.
import dagster as dg


@dg.asset
def pdb_asset(context: dg.AssetExecutionContext):
    x = 10
    context.pdb.set_trace()
    x += 5
    x += 20
Step 2: Launch the webserver and materialize your asset
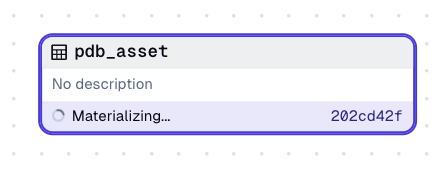
Next, launch the Dagster webserver from your terminal with dagster dev, then, in the UI, materialize the asset. The asset will remain in a "Materializing" state while the interactive debugger is running.
Step 3: Debug your asset in the pdb debugger
In the terminal where dagster dev is running, you should now see a pdb debugger:
2025-03-03 15:24:55 -0600 - dagster - DEBUG - __ASSET_JOB - 202cd42f-ecf3-4504-838c-e41f58dbdf78 - 52536 - RUN_START - Started execution of run for "__ASSET_JOB".
2025-03-03 15:24:55 -0600 - dagster - DEBUG - __ASSET_JOB - 202cd42f-ecf3-4504-838c-e41f58dbdf78 - 52536 - ENGINE_EVENT - Executing steps using multiprocess executor: parent process (pid: 52536)
2025-03-03 15:24:55 -0600 - dagster - DEBUG - __ASSET_JOB - 202cd42f-ecf3-4504-838c-e41f58dbdf78 - 52536 - pdb_asset - STEP_WORKER_STARTING - Launching subprocess for "pdb_asset".
2025-03-03 15:24:55 -0600 - dagster - DEBUG - __ASSET_JOB - 202cd42f-ecf3-4504-838c-e41f58dbdf78 - 52540 - pdb_asset - STEP_WORKER_STARTED - Executing step "pdb_asset" in subprocess.
2025-03-03 15:24:55 -0600 - dagster - DEBUG - __ASSET_JOB - 202cd42f-ecf3-4504-838c-e41f58dbdf78 - 52540 - pdb_asset - RESOURCE_INIT_STARTED - Starting initialization of resources [io_manager].
2025-03-03 15:24:55 -0600 - dagster - DEBUG - __ASSET_JOB - 202cd42f-ecf3-4504-838c-e41f58dbdf78 - 52540 - pdb_asset - RESOURCE_INIT_SUCCESS - Finished initialization of resources [io_manager].
2025-03-03 15:24:55 -0600 - dagster - DEBUG - __ASSET_JOB - 202cd42f-ecf3-4504-838c-e41f58dbdf78 - 52540 - LOGS_CAPTURED - Capturing logs for process (pid: 52540).
2025-03-03 15:24:55 -0600 - dagster - DEBUG - __ASSET_JOB - 202cd42f-ecf3-4504-838c-e41f58dbdf78 - 52540 - pdb_asset - STEP_START - Started execution of step "pdb_asset".
--Return--
> /dagster/debugging.py(11)pdb_asset()
-> x += 5
(Pdb)
The pdb debugger will start at the point in the asset where you set the breakpoint, and give you access to any of the variables in the asset that have been defined by that point in the code. At this point the variable x has been defined and set to 10. We can return x to get its current value and see the new statement of the asset above x += 5.
--Return--
> /dagster/debugging.py(11)pdb_asset()
-> x += 5
(Pdb) x
10
You can navigate through the asset code using any pdb commands and access variables at different points to see how values change over time.
--Return--
> /dagster/debugging.py(11)pdb_asset()
-> x += 5
(Pdb) x
10
(Pdb) next
> /dagster/debugging.py(12)pdb_asset()
-> x += 20
(Pdb) x
15
(Pdb) next
> /dagster/debugging.py(13)pdb_asset()
-> return x
(Pdb) x
35
(Pdb)
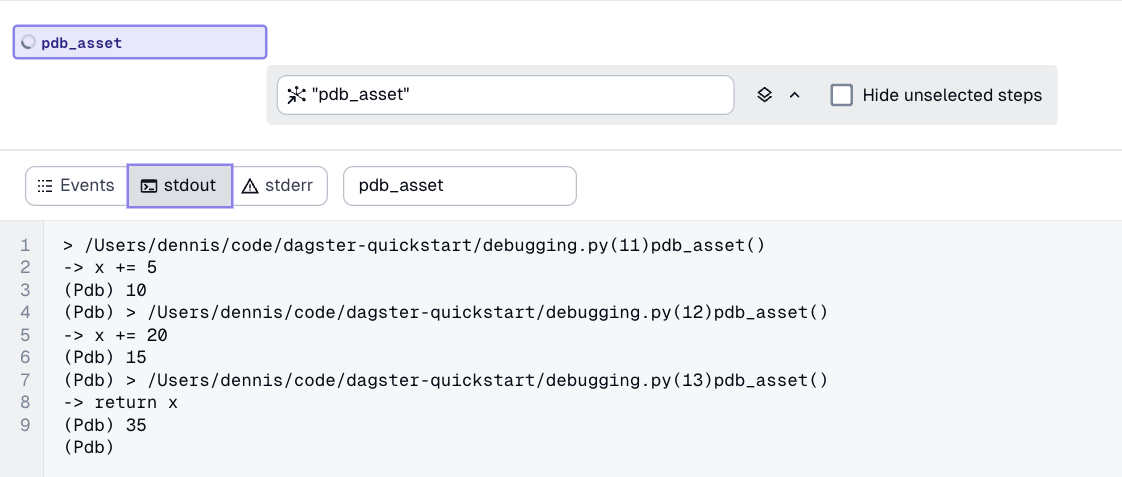
While these pdb commands occur in the terminal, they will also be recorded in stdout of the Dagster asset execution:
Step 4: End debugging and finish materializing your asset
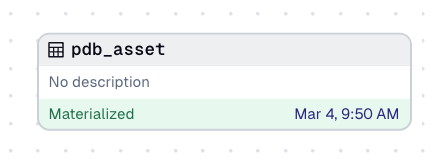
The asset will remain in the "Materializing" state until you have navigated through all the statements of the asset with next or until you execute continue within pdb. The asset will then finish materializing and close pdb in the terminal: