Insights (Dagster+)
This feature is only available in Dagster+.
Using Dagster+ Insights, you can gain visibility into historical usage and trends, such as execution time, success rate, and time to resolving failures. You can also build custom reports to compare different deployments or selections of assets against each other to quickly identify issues across your data platform.
With Insights, you can:
- Understand platform health with real-time Insights views
- Compare metrics across asset selections
- Track cost metrics for external services
- Create alerts based off of Insights metrics
Understand platform health with real-time Insights views
Real-time Insights views can help you understand the health of Assets, Selections, Jobs, and Deployments.
To access Insights views, you can either:
- Click Insights in the left sidebar, or
- Navigate to a selection of assets in the asset catalog, then click Insights in the top navigation bar.
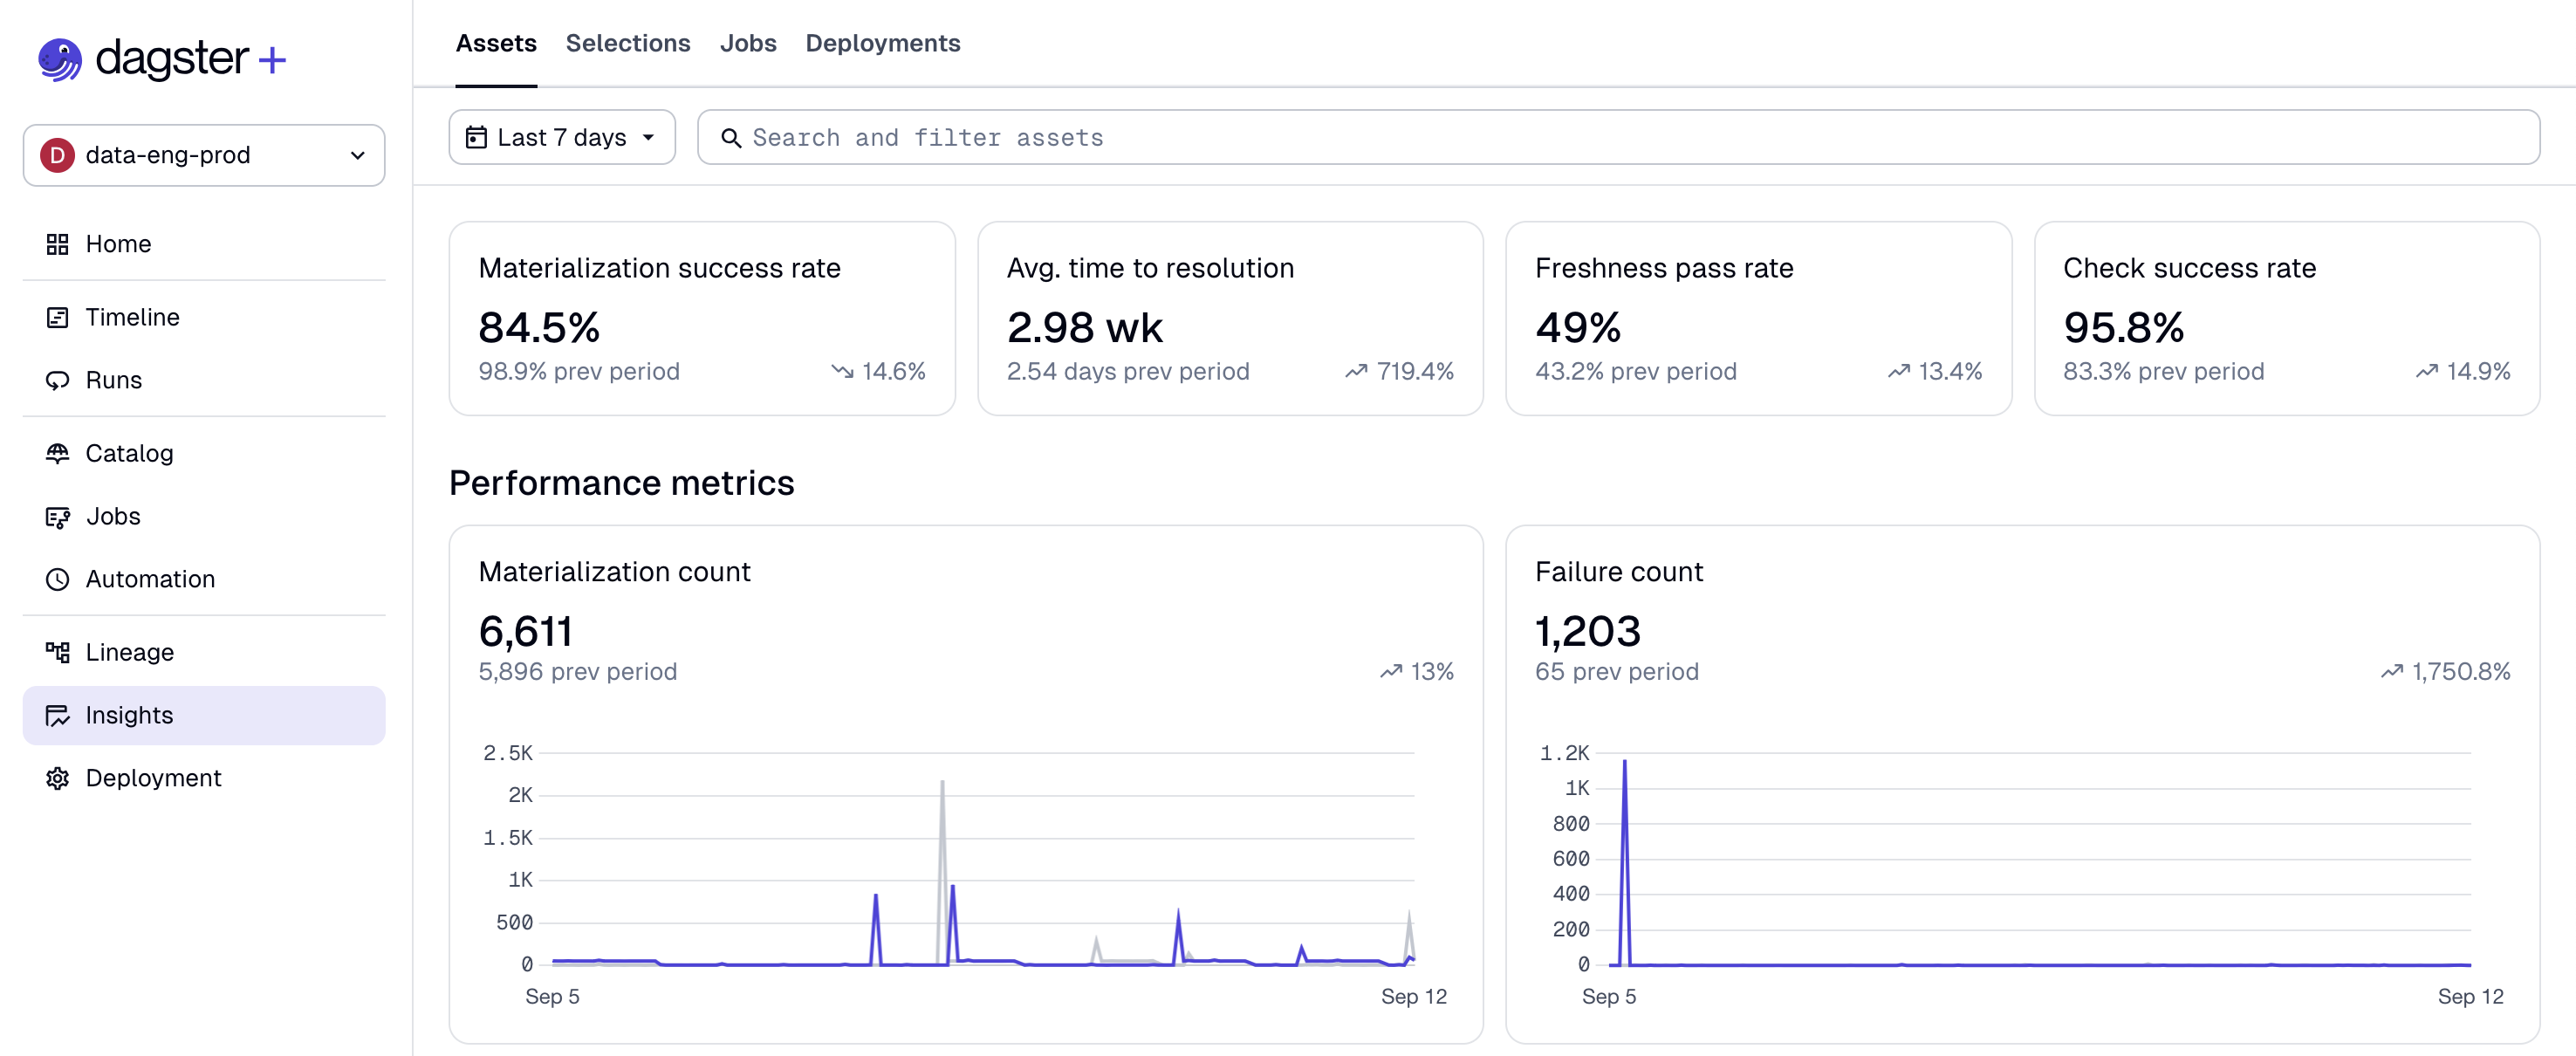
Key asset health metrics, like materialization and failure count, are prominently displayed for assets and selections, and additional metrics are displayed for jobs and deployments. Historical Insights data can be queried for up to 30 days.
For a full list of metrics, see the supported metrics section.
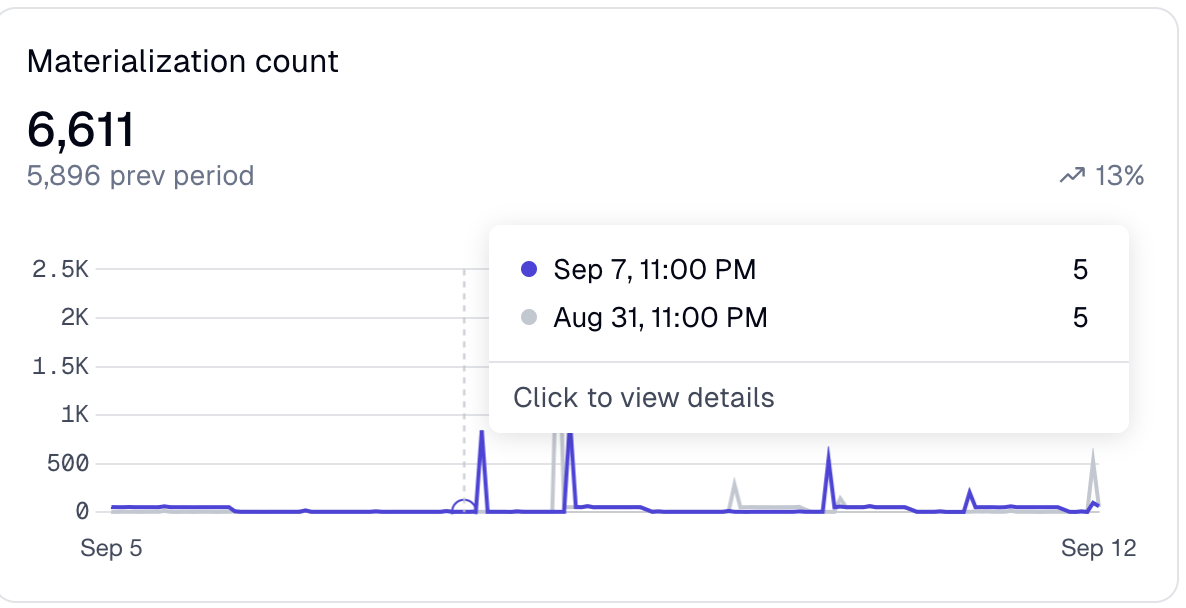
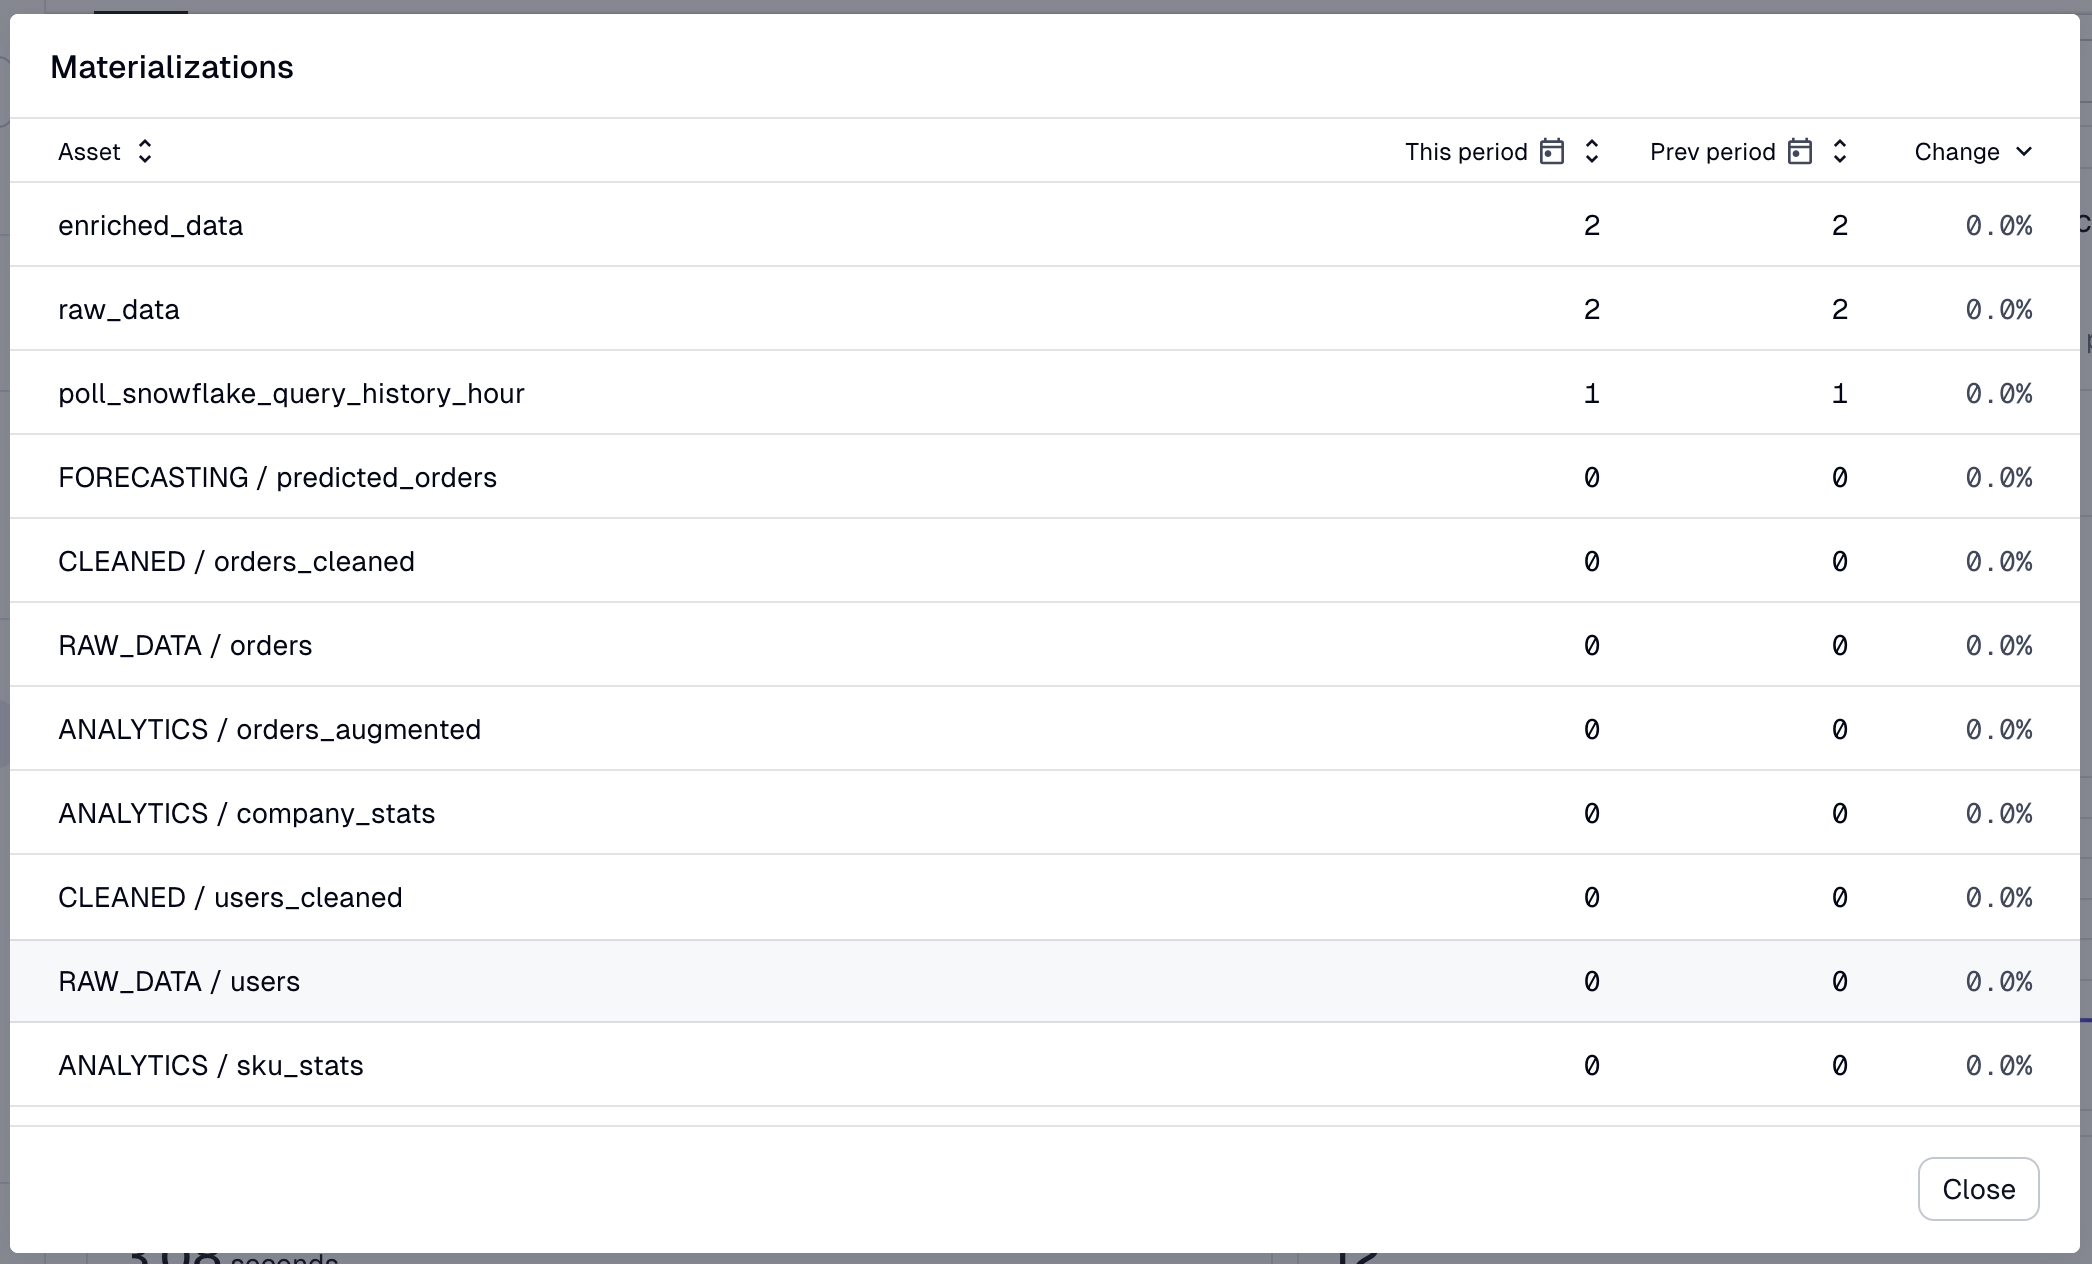
To limit the view to a specific set of assets, type an asset selection in the search bar. Or, to view specific events in a time slice, hover over a datapoint in the line chart, then click to view details:
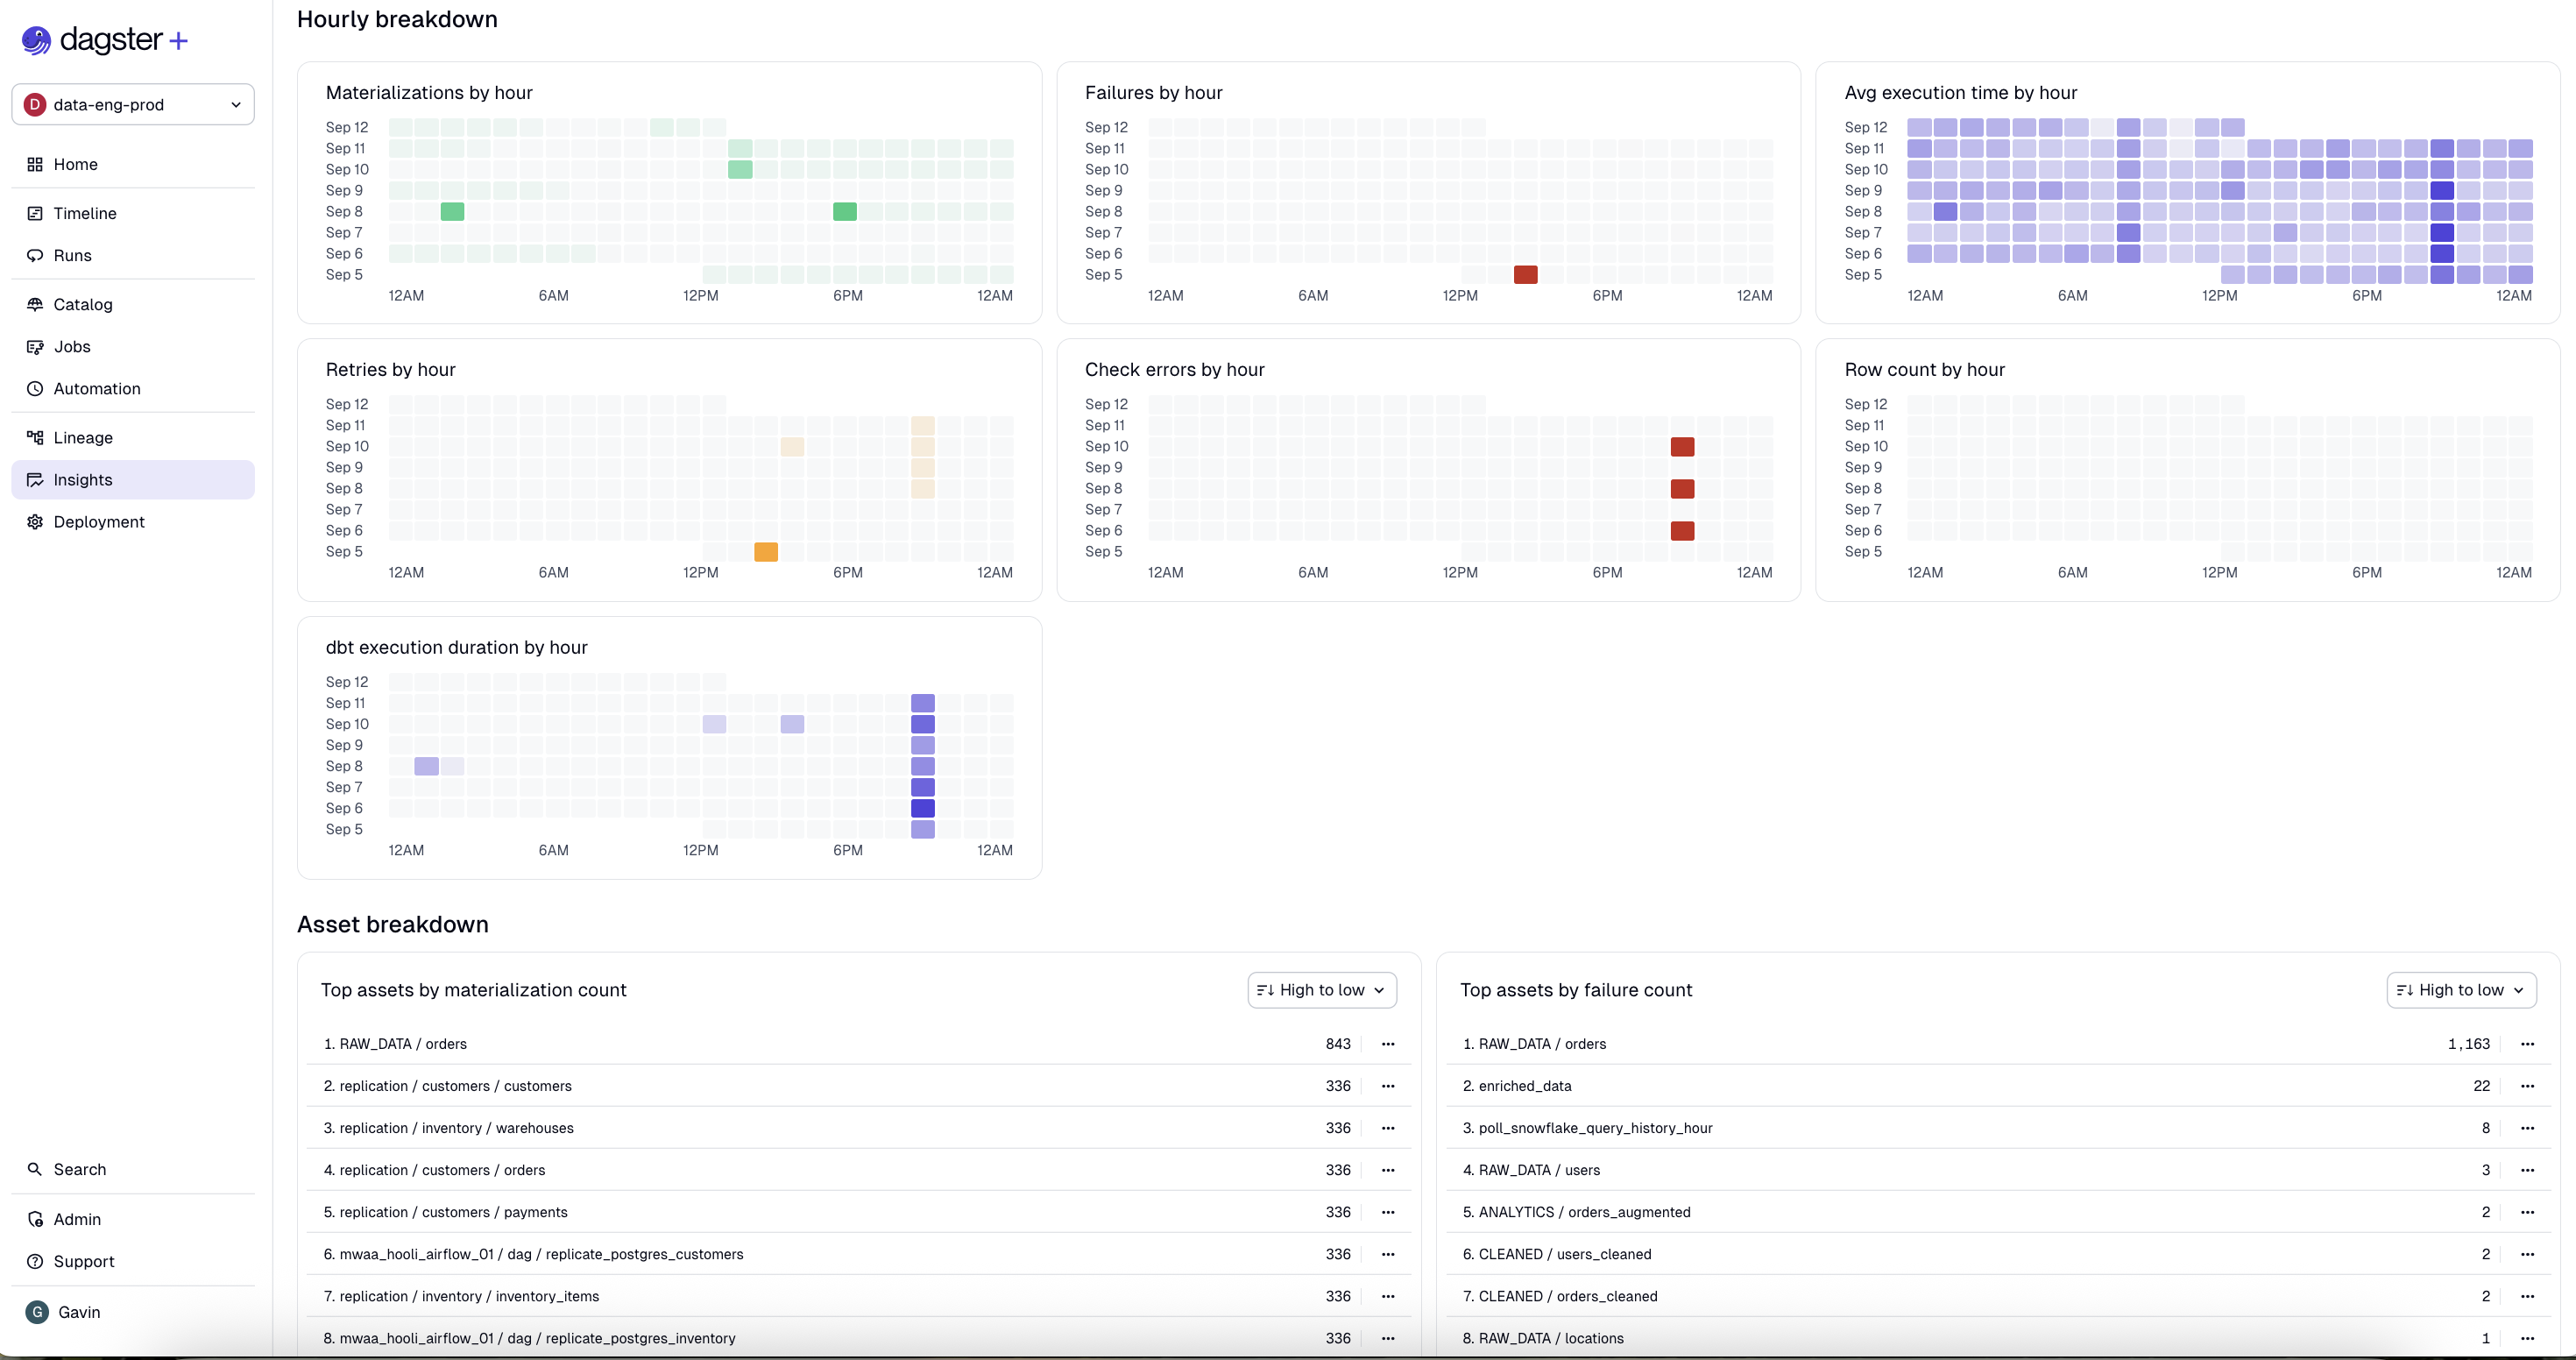
Insights views also features activity charts that group events by hour to help you understand scheduling and automation behaviors:
Compare metrics across asset selections
Insights views allow you to compare metrics across all assets, or a chosen subset of saved asset selections.
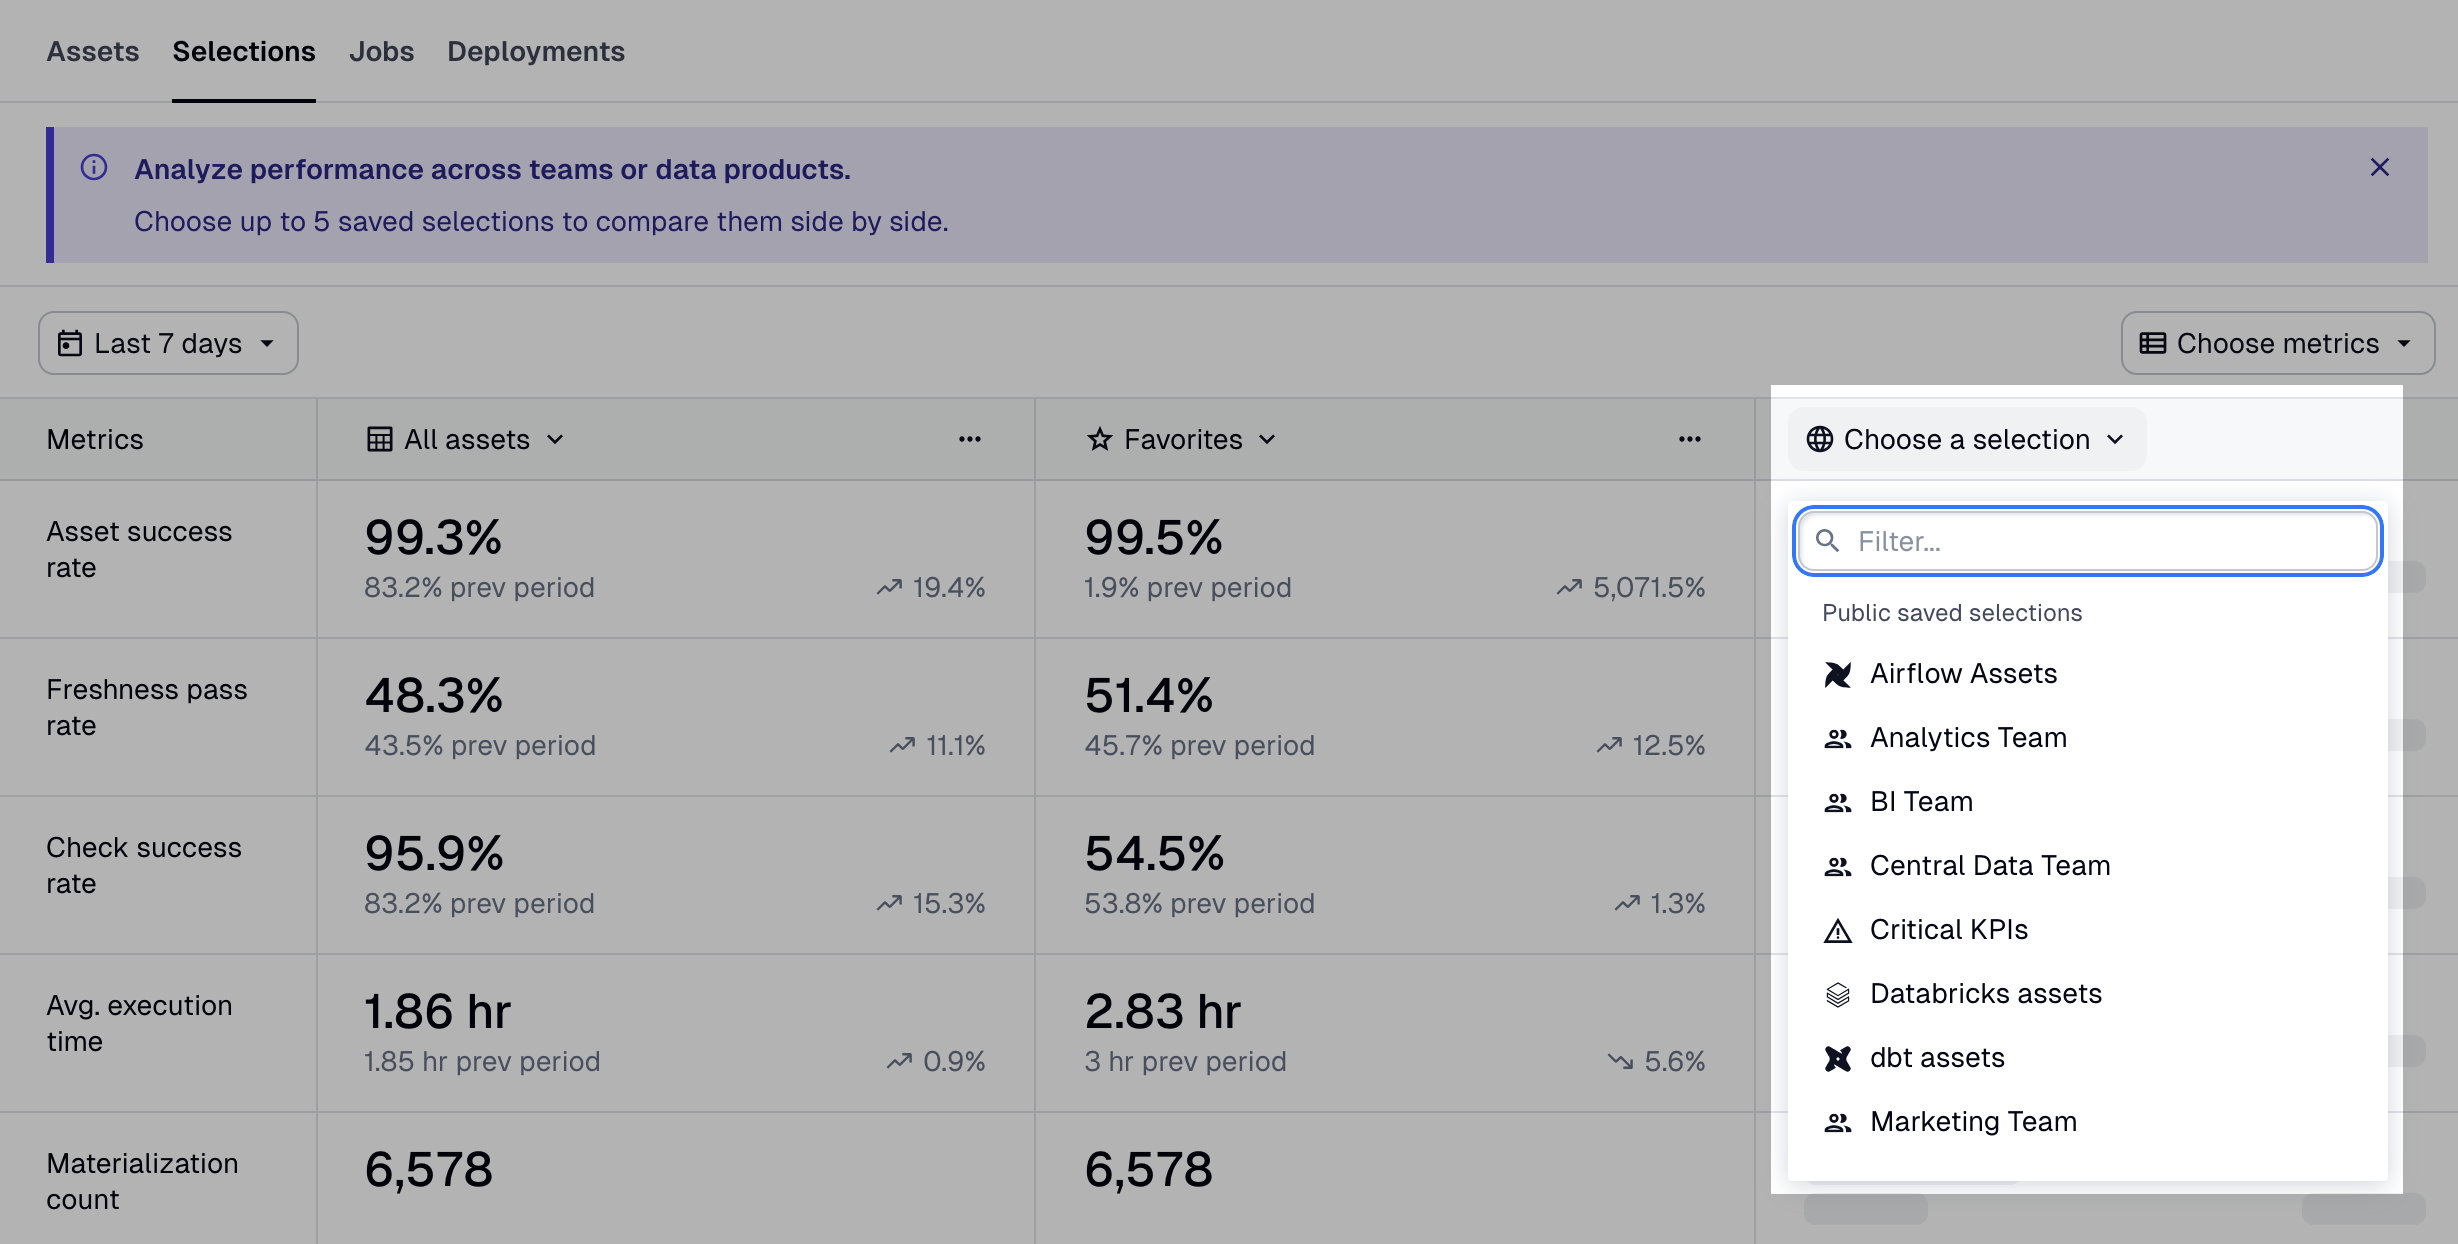
To compare metrics across specific selections, navigate to the Selections tab, then click Choose a selection. You can choose up to five saved selections:
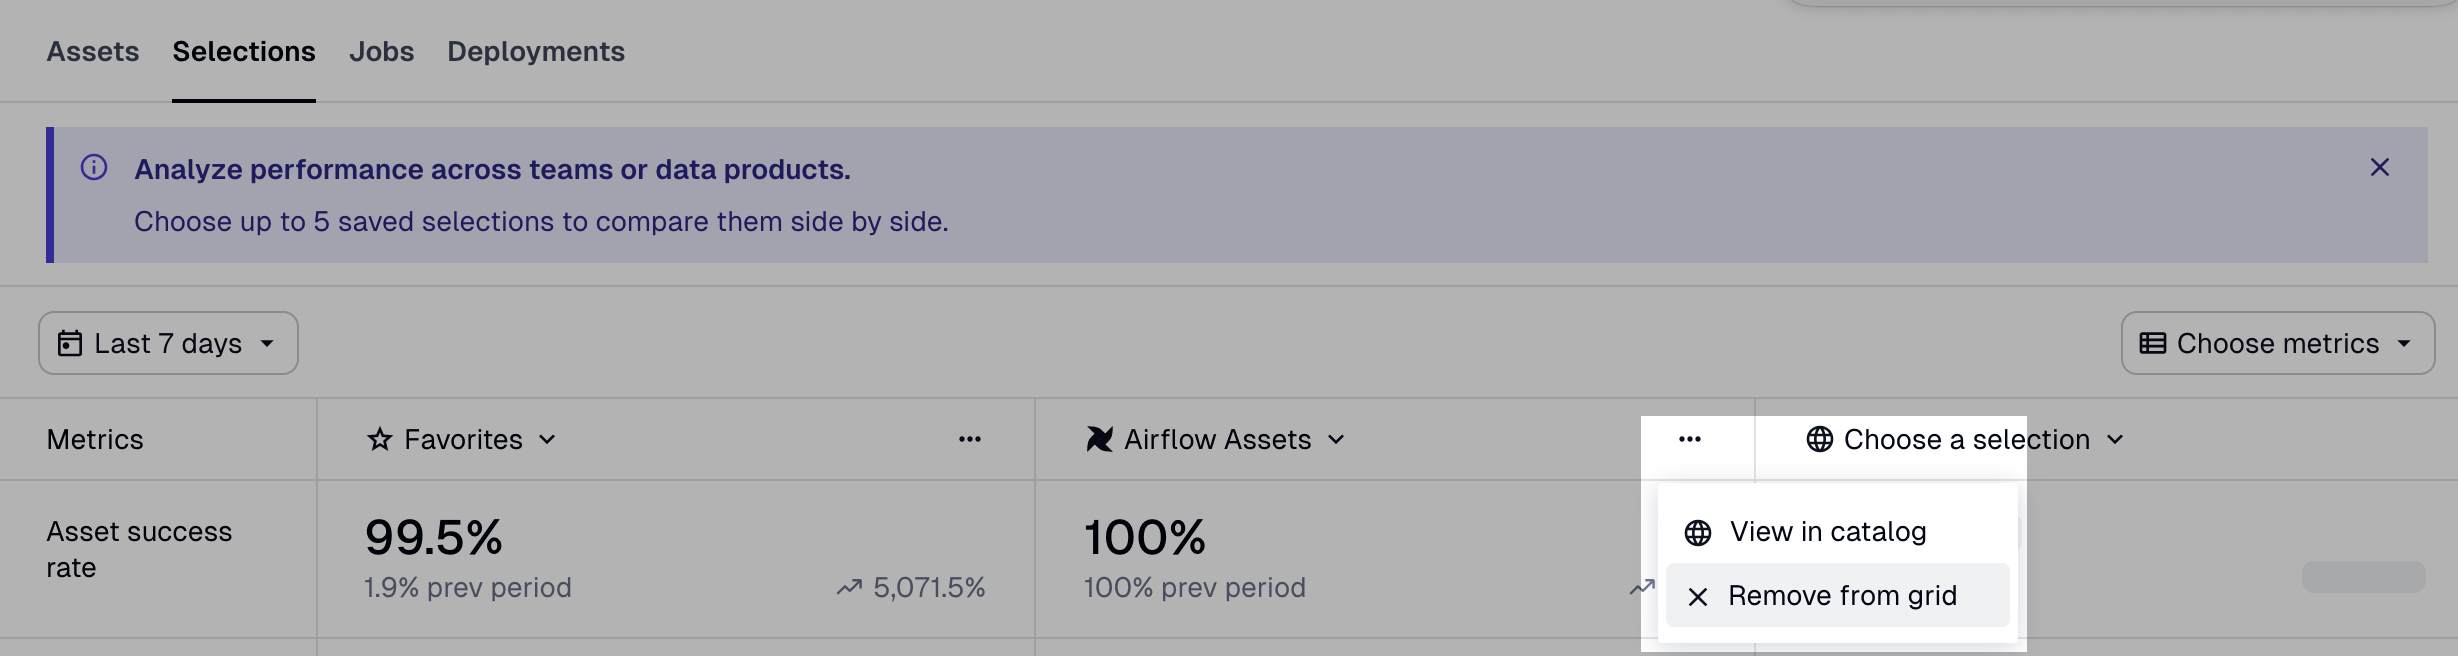
To remove a selection from comparison, click the three dots menu on the selection column, then click Remove from grid:
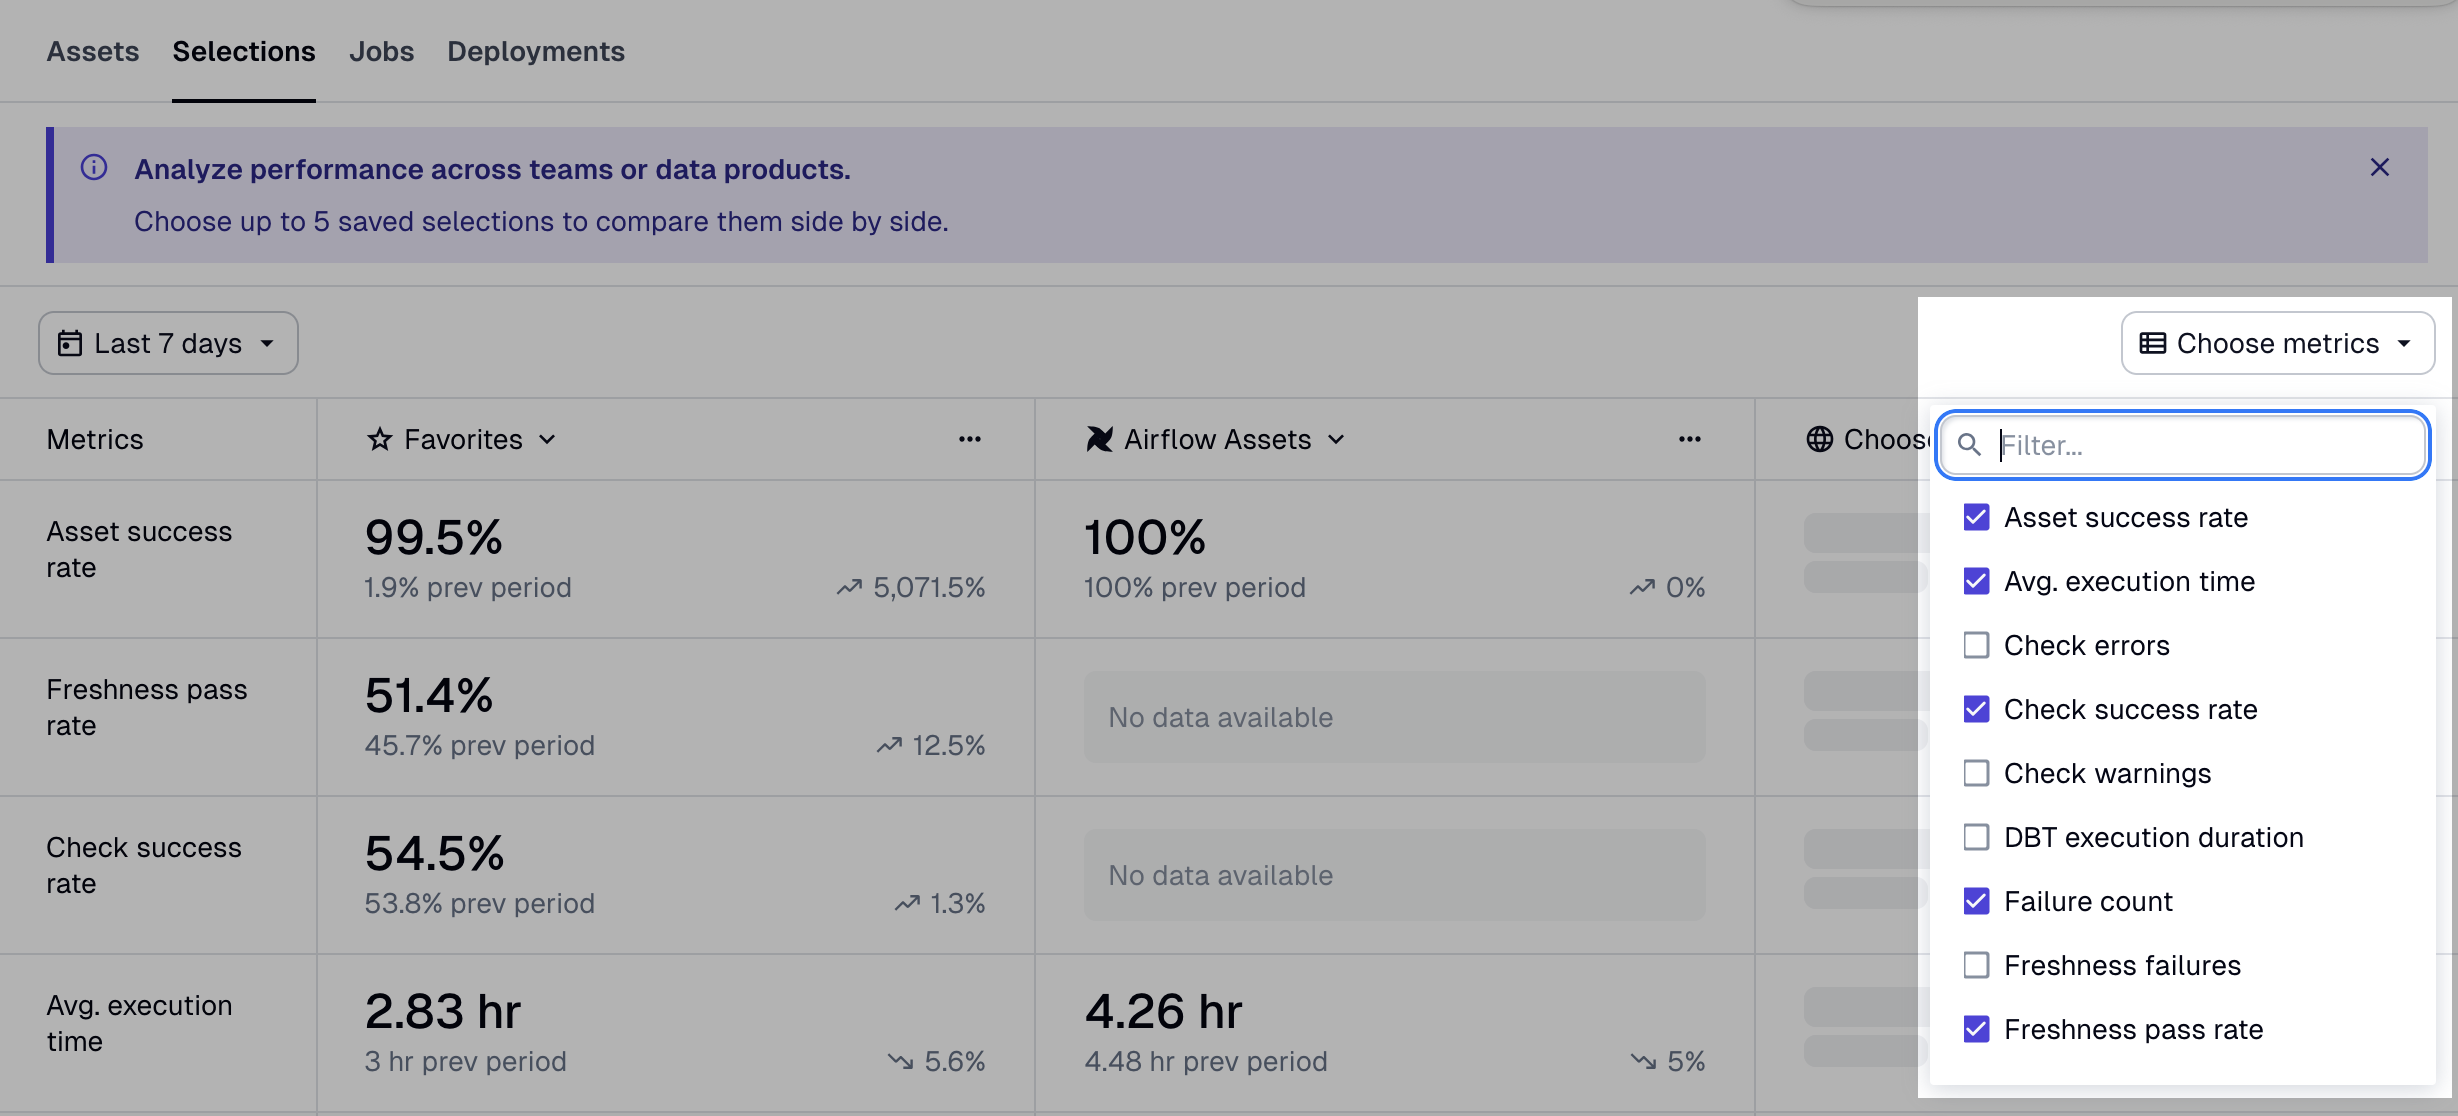
To choose which metrics to compare across selections, click Choose metrics, then check the metrics you'd like to include:
Supported metrics
Assets and selections
| Metric | Description |
|---|---|
| Materialization success rate | Average of materialization success rates for all assets in selection over the selected time range. A single asset's materialization success rate is (number of successful materializations) / (number of successful materializations + number of failed materializations) for that asset. Note that failed retries do not count towards the number of failed materializations in the denominator of the success rate calculation. |
| Avg. time to resolution | Average time the selected assets spent in a failed materialization state before being successfully materialized. |
| Freshness pass rate | Average percentage of time that assets from the selection with a defined freshness policy were passing their freshness policy. |
| Check success rate | Average of check success rates for all assets in selection over the selected time range. A single asset's check success rate is (number of passing check executions) / (number of total check executions). |
| Materialization count | Count of successful materialization attempts. Each retry is counted as a distinct materialization attempt. |
| Failure count | Count of failed materialization attempts. Each retry is counted as a distinct materialization attempt. |
| Step execution time | Total step execution time for selected assets. Includes time spent by steps that failed to materialize an asset, steps that retried an asset, and steps that ran asset checks. |
| User-defined numeric asset metadata | Defined by you and powered by the numeric metadata your assets emit at runtime. For more information, see Custom metrics. |
Jobs
| Metric | Description |
|---|---|
| Run success count | Count of successful runs for the selected jobs. The count includes run retries. |
| Run failure count | Count of failed runs for the selected jobs. The count includes runs that failed for any reason, including but not limited to timeouts, step failure, and run worker restarts. The count also includes run retries. |
| Run duration | Total duration of runs for selected jobs. Each run retry is counted as a separate run. |
| Step failures | Count of step failures across all runs for the selected jobs. |
| Dagster credits | Total Dagster credits consumed by all runs for the selected jobs. For more information, see the pricing FAQ. |
| Materializations | Count of successful asset materializations produced by runs for the selected jobs. |
| Failed to materialize | Count of failed asset materialization attempts by selected jobs. A failed materialization attempt is when a run that expects to materialize an asset does not do so, either because the run itself failed or the run completed but did not materialize the asset. Each run retry counts as a distinct materialization attempt. |
| Observations | Count of asset observations recorded by the selected jobs. Does not include runless asset observations. |
| Step retries | Count of step retries across all runs for the selected jobs. Run retries by themselves do not contribute to this metric, only retries of the underlying step. |
Deployments
| Metric | Description |
|---|---|
| Dagster credits | The Dagster credit cost associated with computing this object. Dagster credits are charged for every step that's run, and for every asset that's materialized. For more information, see the pricing FAQ. |
| Compute duration | The time spent computing steps. For jobs that run steps in parallel, the compute duration may be longer than the wall clock time it takes for the run to complete. |
| Run duration | Wall clock time from when a run starts to when it completes. For jobs which run steps in parallel, the run duration may be shorter than the sum of the compute duration for all steps. |
| Materializations | The number of asset materializations associated with computing this object. |
| Observations | The number of asset observations associated with computing this object. |
| Step failures | The number of times steps failed when computing this object. Steps that retry and succeed aren't included in this metric. |
| Run concurrency | Number of runs executing concurrently in this deployment. Each chart bucket shows the peak (maximum) concurrent count within that time window. |
Track cost metrics for external services
With Dagster+ Insights, you can track metrics for BigQuery and Snowflake, such as query runtime and billed usage, and associate them with the relevant assets or jobs.