Dagster webserver and UI
The Dagster webserver serves the Dagster UI, a web-based interface for viewing and interacting with Dagster objects. It also responds to GraphQL queries.
In the UI, you can inspect Dagster objects (such as assets, jobs, schedules), launch runs, view launched runs, and view assets produced by those runs.
Launching the webserver
The easiest way to launch the webserver from the command line during local development is to run:
dg dev
This command launches both the Dagster webserver and the Dagster daemon, allowing you to start a full local deployment of Dagster from the command line.
The command will print out the URL you can access the UI from in the browser, usually on port 3000.
When invoked, the webserver will fetch definitions - such as assets, jobs, schedules, sensors, and resources - from a Definitions object in a Python module or package or the code locations configured in an open source deployment's workspace files. For more information, see the code locations documentation.
Note that several Dagster features, like schedules and sensors, require the Dagster daemon to be running in order to function.
Dagster UI reference
Overview page
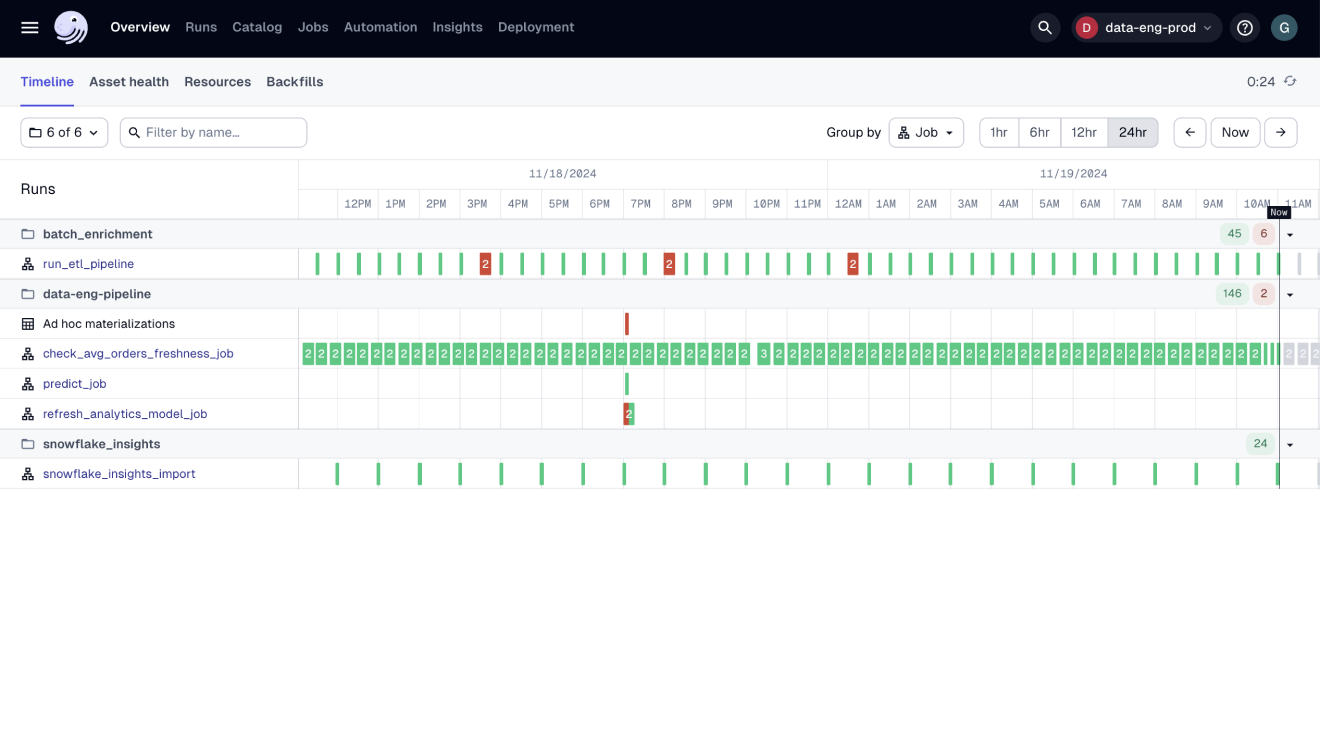
The Overview page, also known as the "factory floor", provides a high-level look at the activity in your Dagster deployment, across all code locations. This includes information about runs, jobs, schedules, sensors, resources, and backfills, all of which can be accessed using the tabs on this page.
To access the overview page, click Overview in the top navigation bar.
Assets
- Asset catalog (OSS)
- Asset catalog (Dagster+ Pro)
- Asset selections (Dagster+)
- Global asset lineage
- Asset details
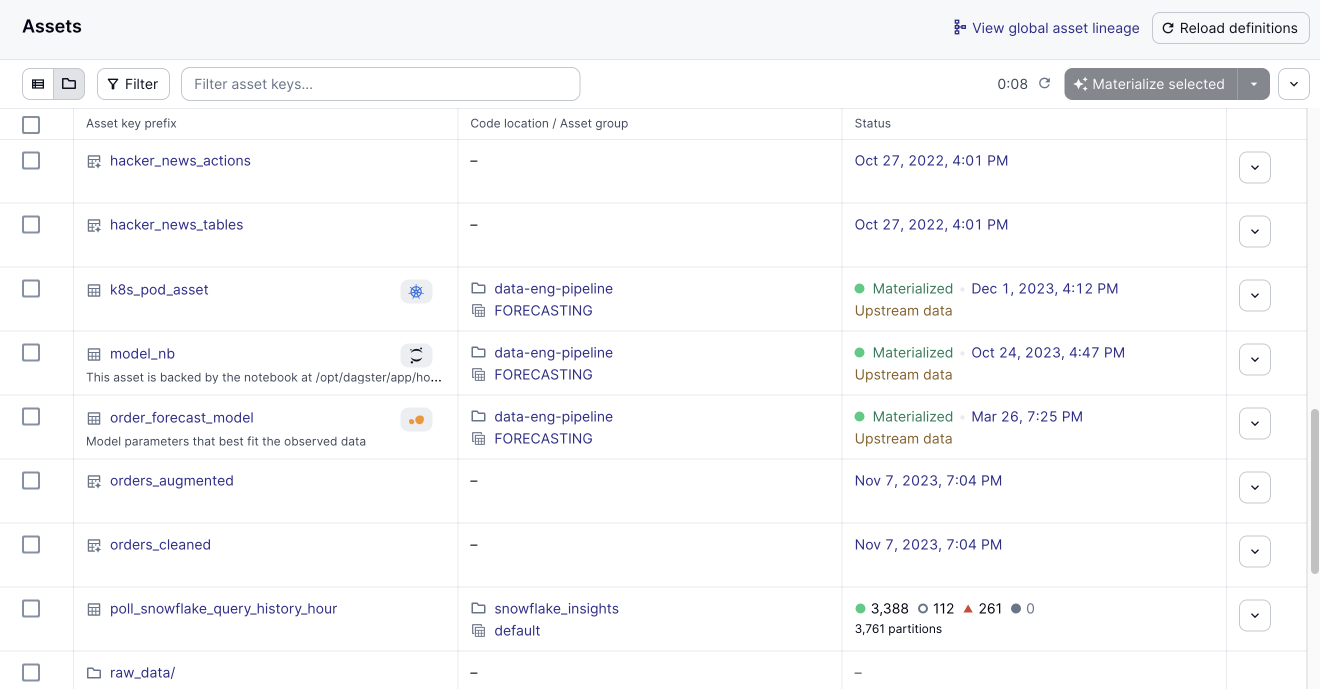
The Asset catalog page lists all assets in your Dagster deployment, which can be filtered by asset key, compute kind, asset group, code location, and tags.
Clicking an asset opens the Asset details page for that asset. You can also navigate to the Global asset lineage page, reload definitions, and materialize assets.
To access the asset catalog page, click Assets in the top navigation bar.
This feature is only available in Dagster+ Pro.
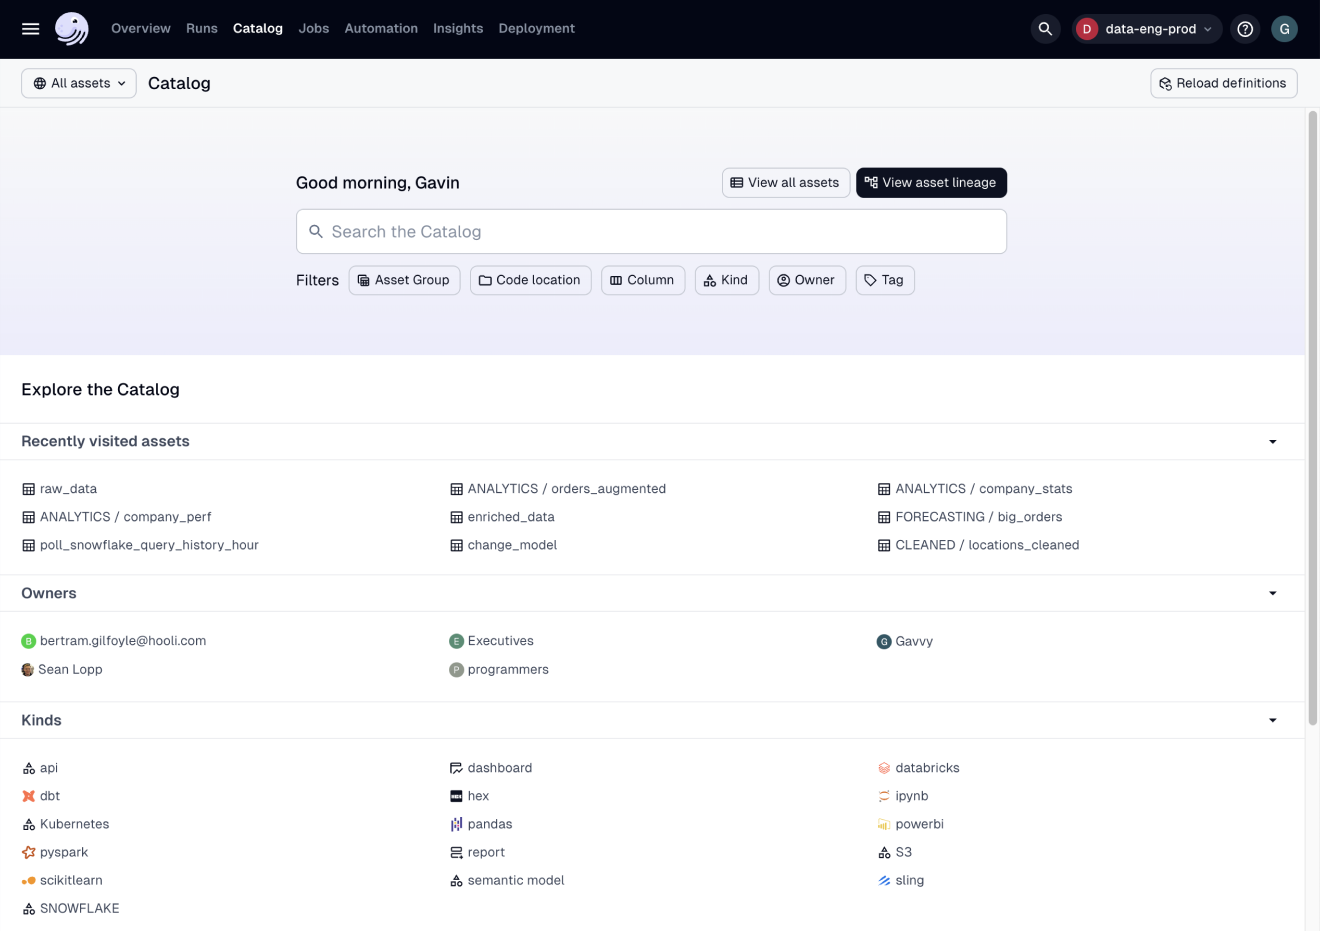
The Dagster+ Pro Asset catalog page includes all the information and functionality of the original page, broken out by saved selections, asset group, kind, owners, tags, and code location.
On this page, you can:
- View all assets in your Dagster deployment
- View saved selections of assets
- Filter assets by asset key, asset group, code location, column, column tag, table name, kind, owner, and tag
- Access the global asset lineage page
- Reload definitions
To access this page, click Catalog in the top navigation bar:
Asset selections save a set of filters against the Asset catalog to show only the assets you want to see. You can share these views for easy access and faster team collaboration.
With Asset selections, you can:
- Select a scoped set of assets in your Dagster deployment
- Create shared selections of assets for easier team collaboration
You can access asset selections by clicking Catalog in the top navigation, then clicking the Saved selections tab.
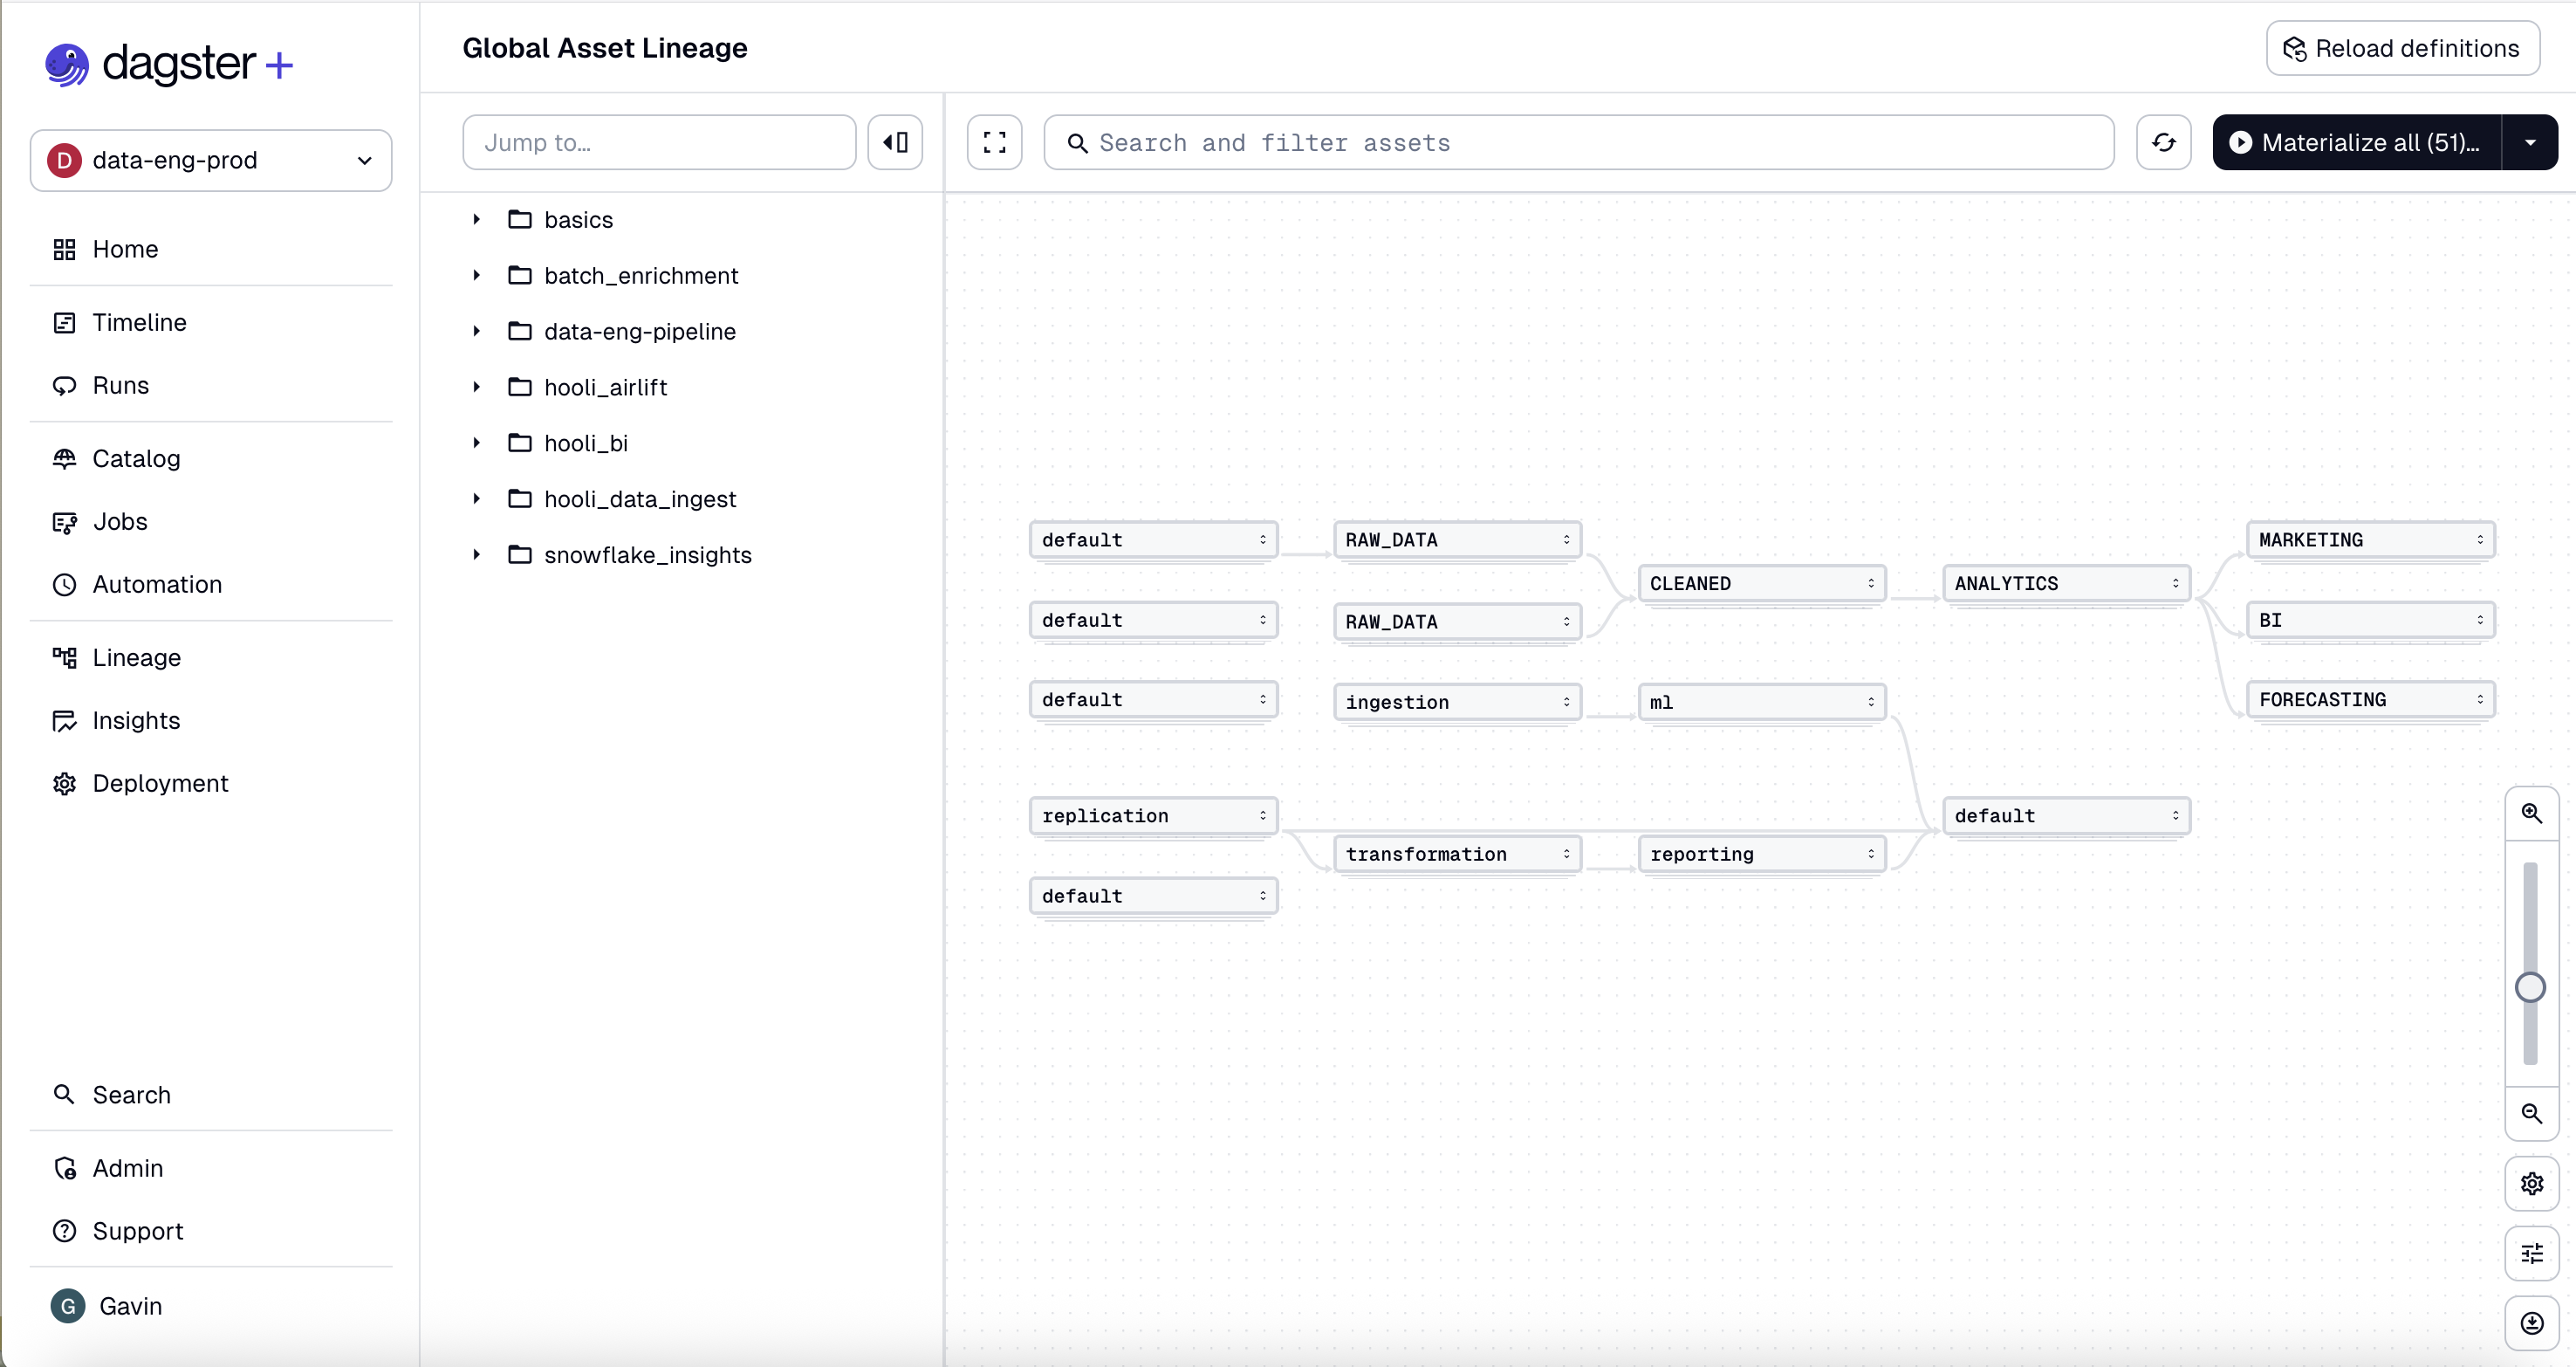
The Global asset lineage page displays dependencies between all of the assets in your Dagster deployment, across all code locations.
On this page, you can:
-
Filter assets by group
-
Filter a subset of assets by using asset selection syntax
-
Customize facets displayed for each asset
-
Reload definitions
-
Materialize all or a selection of assets
-
View run details for the latest materialization of any asset
-
Accessed by:
- From the Asset catalog: Clicking View global asset lineage, located near the top right corner of the page.
- From the Asset details page: Clicking the Lineage tab.
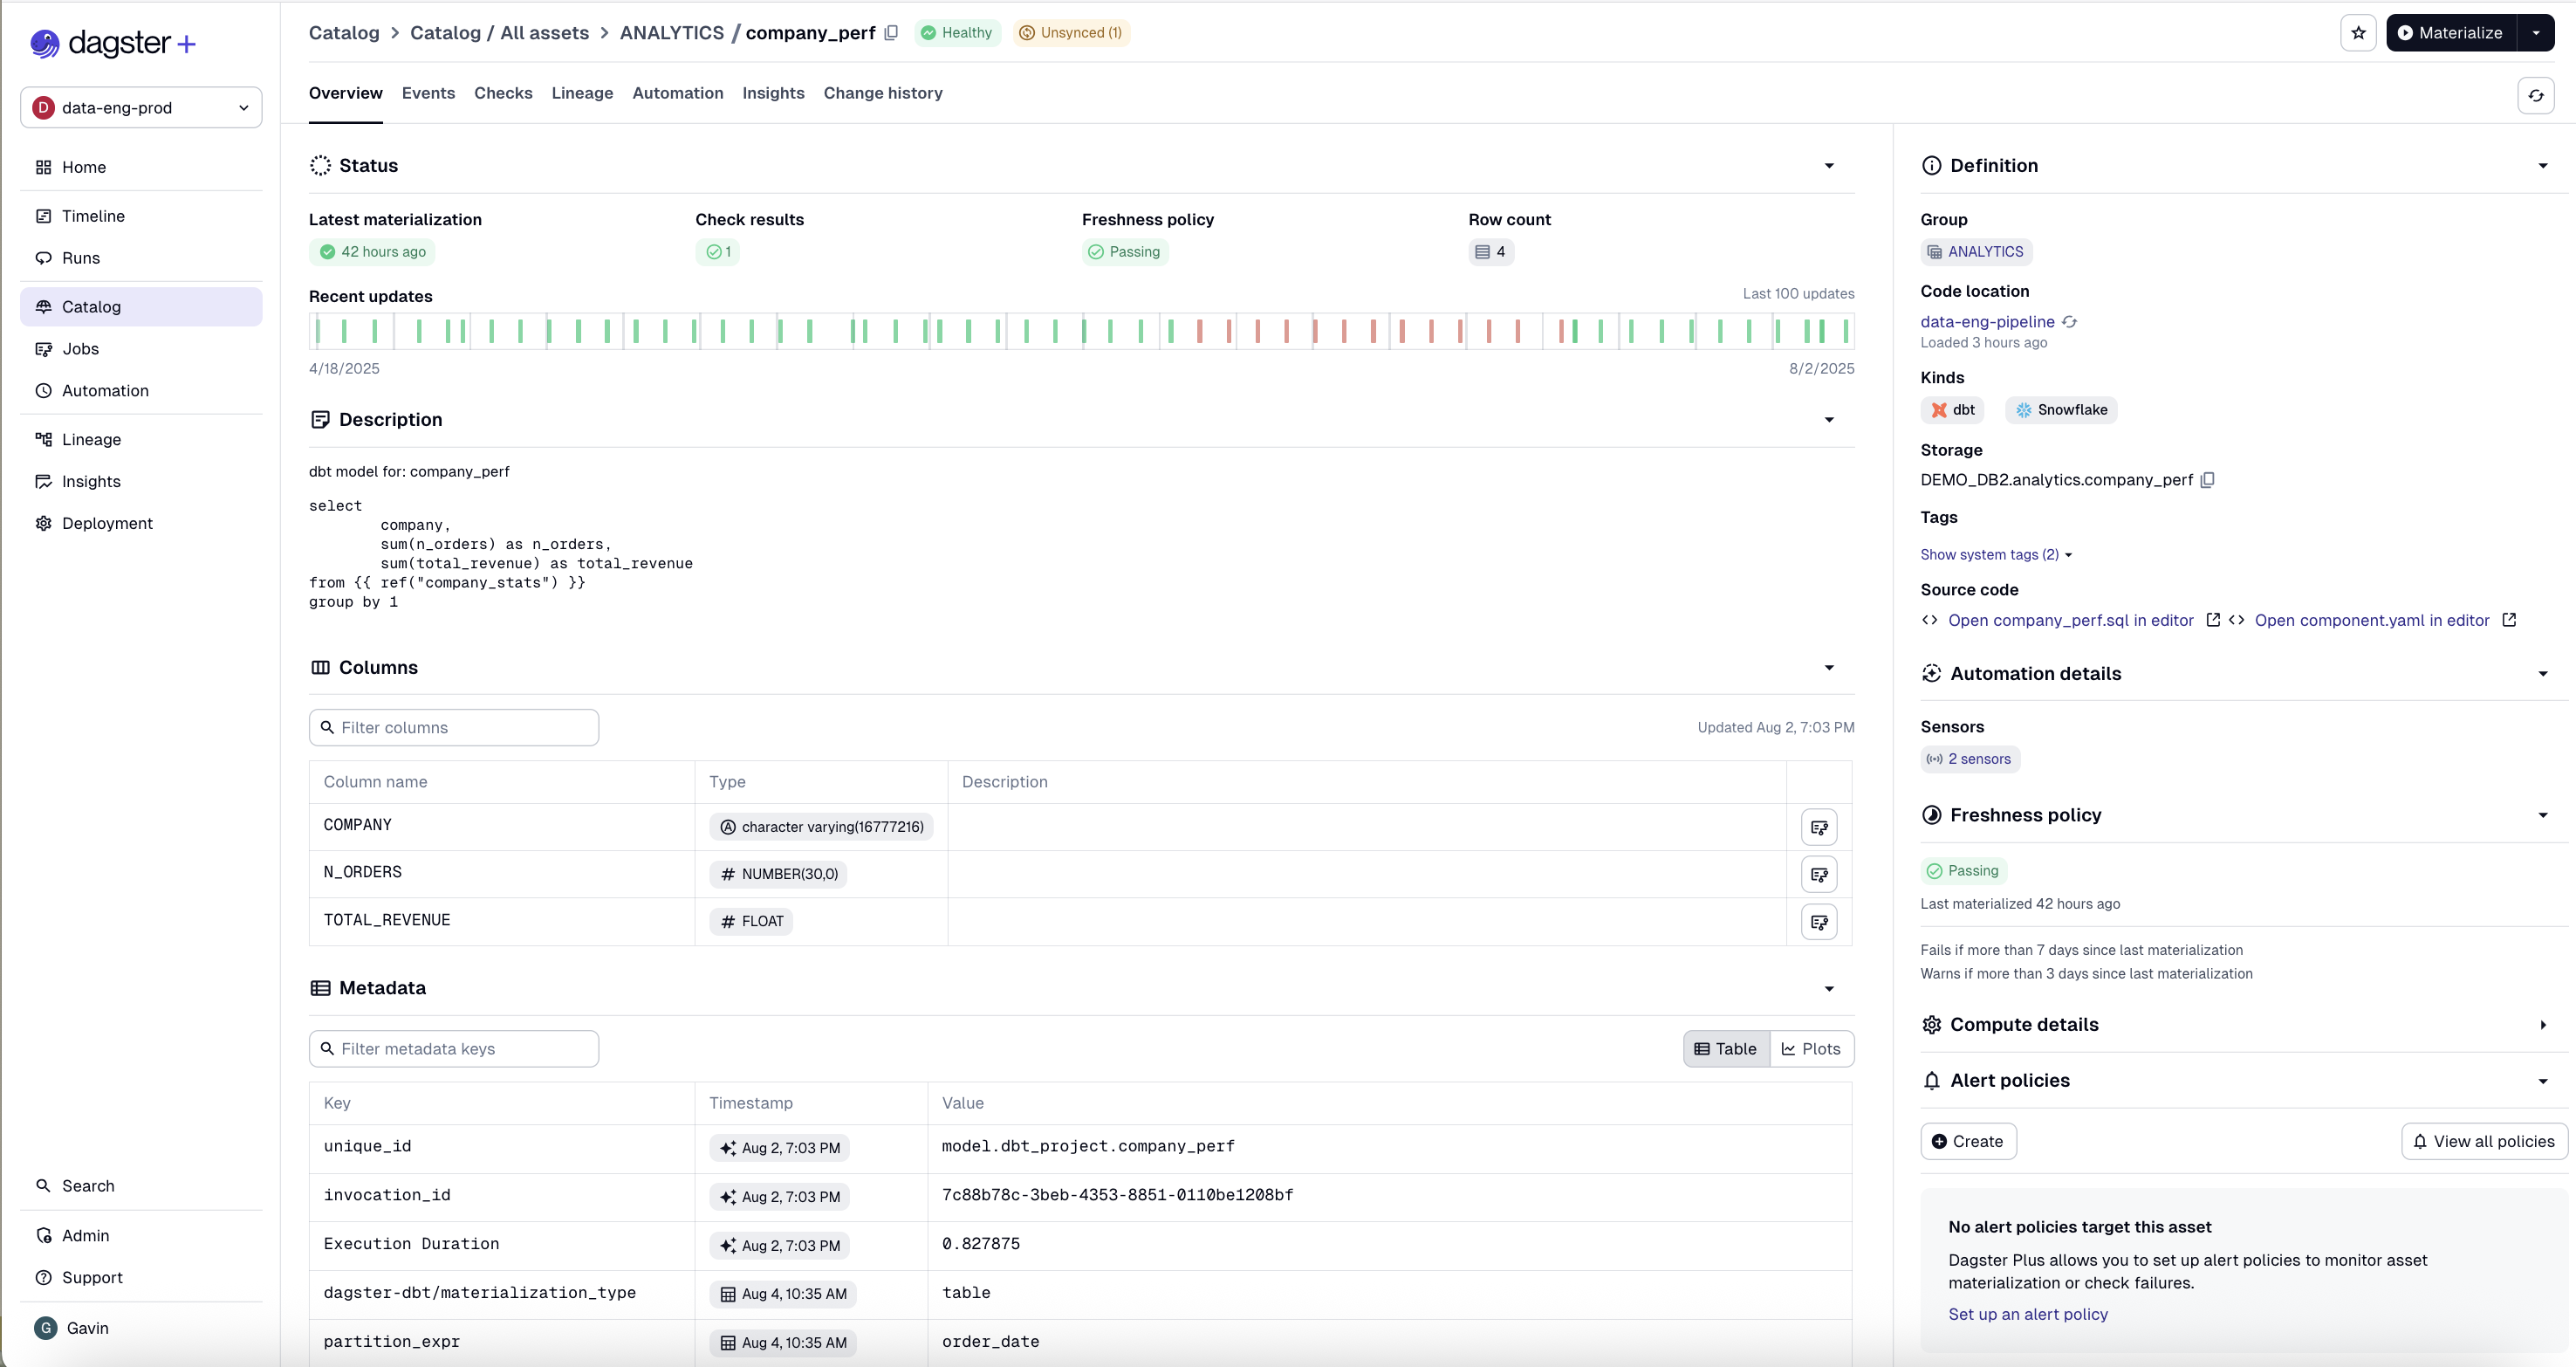
The Asset details page contains details about a single asset. Use the tabs on this page to view detailed information about the asset:
- Overview - Information about the asset such as its description, resources, config, type, etc.
- Partitions - The asset's partitions, including their materialization status, metadata, and run information
- Events - The asset's materialization history
- Checks - The Asset checks defined for the asset
- Lineage - The asset's lineage in the Global asset lineage page
- Automation - The Declarative Automation conditions associated with the asset
- Insights - Dagster+ only. Historical information about the asset, such as failures and credit usage. Refer to the Dagster+ Insights documentation for more information.
To access the asset details page, click an asset in the Asset catalog.
Runs
- All runs
- Run details
- Run logs
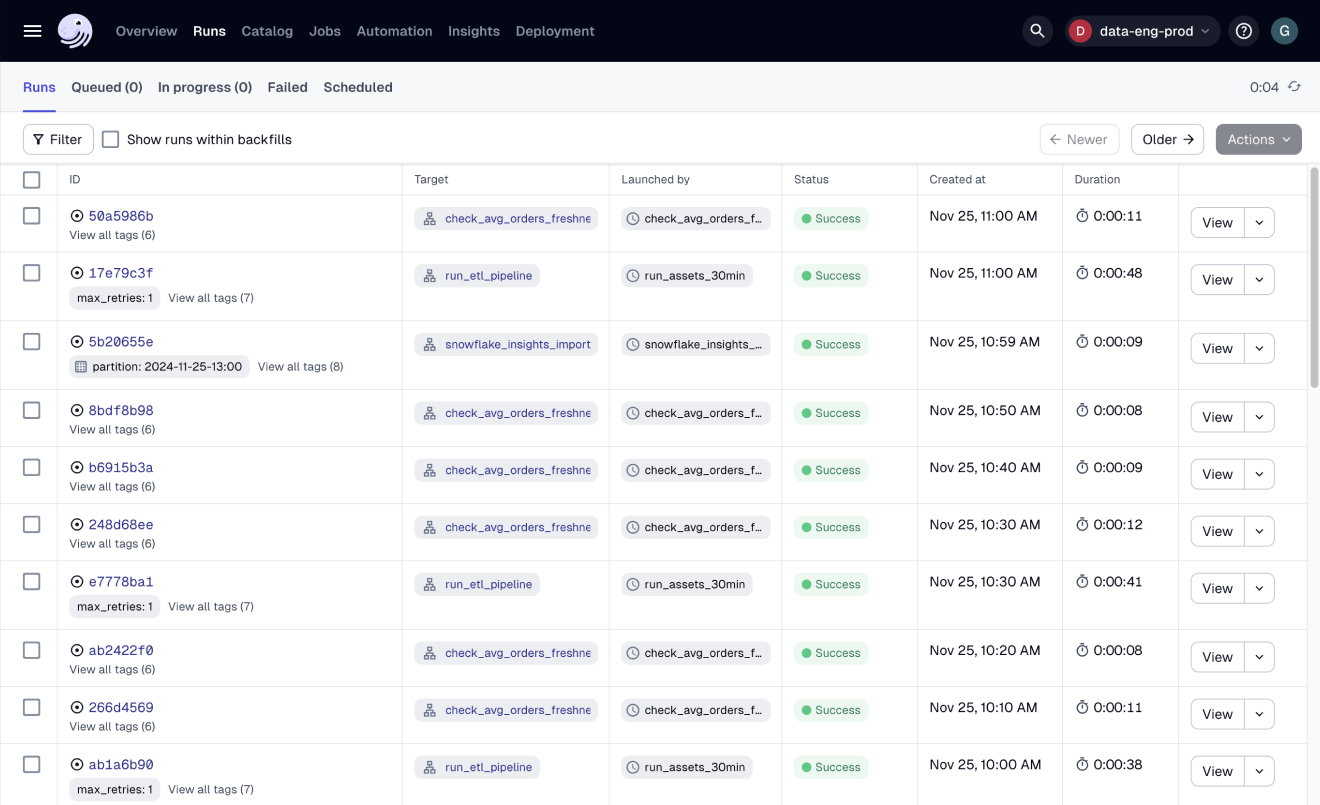
The Runs page lists all job runs, which can be filtered by job name, run ID, execution status, or tag. Click a run ID to open the Run details page and view details for that run.
To access the runs page, click Runs in the top navigation bar.
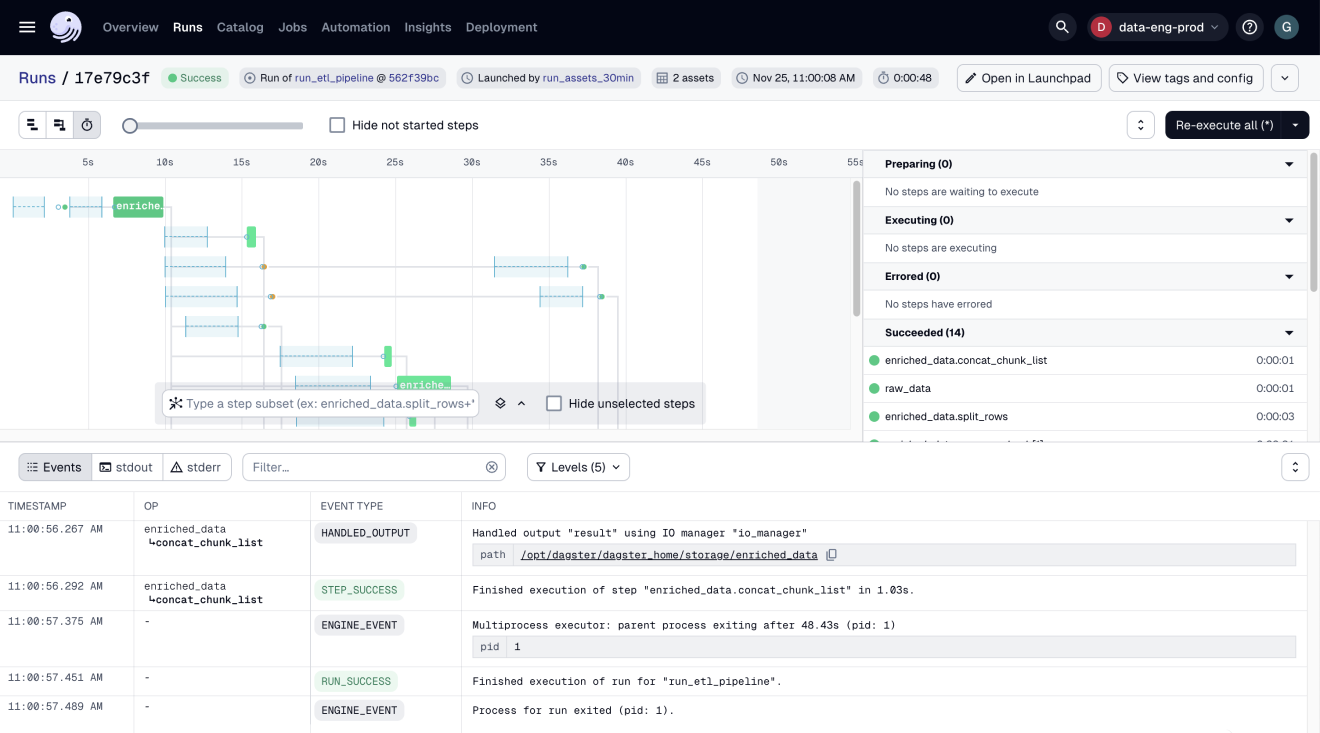
The Run details page contains details about a single run, including timing information, errors, and logs. The upper left pane contains a Gantt chart, indicating how long each asset or op took to execute. The bottom pane displays filterable events and logs emitted during execution.
On this page, you can:
- View structured event and raw compute logs. Refer to the run logs tab for more info.
- Re-execute a run using the same configuration by clicking the Re-execute button. Related runs (e.g., runs created by re-executing the same previous run) are grouped in the right pane for easy reference
To access the run details page, click a run in the Run details page.
Located at the bottom of the Run details page, the run logs list every event that occurred in a run, the type of event, and detailed information about the event itself. There are two types of logs, which we'll discuss in the next section:
- Structured event logs
- Raw compute logs
To access the run logs, scroll to the bottom of the Run details page.
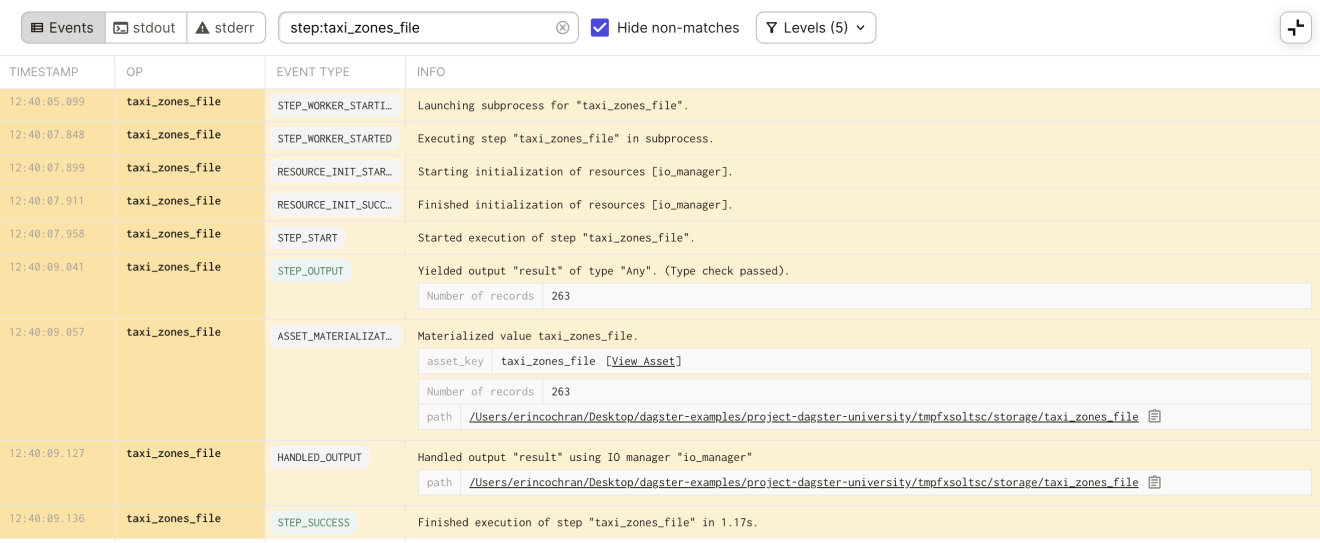
Structured event logs
- Description: Structured logs are enriched and categorized with metadata. For example, a label of which asset a log is about, links to an asset’s metadata, and what type of event it is available. This structuring also enables easier filtering and searching in the logs.
To access the structured event logs, click the left side of the toggle next to the log filter field.
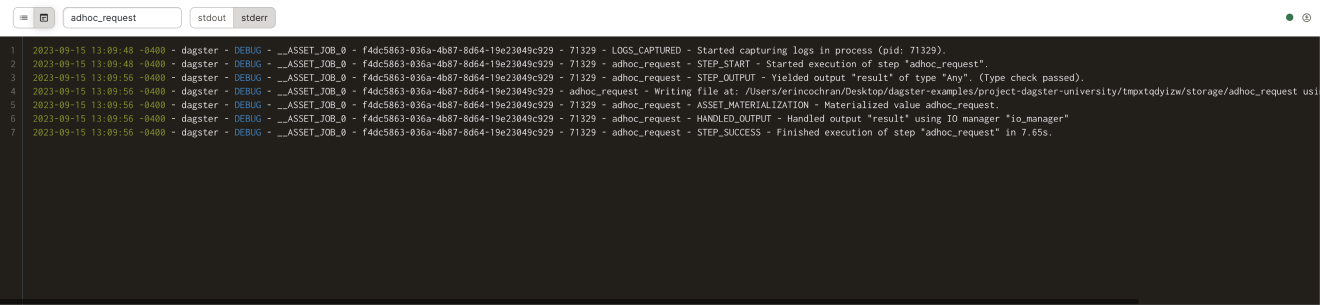
Raw compute logs
The raw compute logs contain logs for both stdout and stderr, which you can toggle between. To download the logs, click the arrow icon near the top right corner of the logs.
To access the raw compute logs, click the right side of the toggle next to the log filter field.
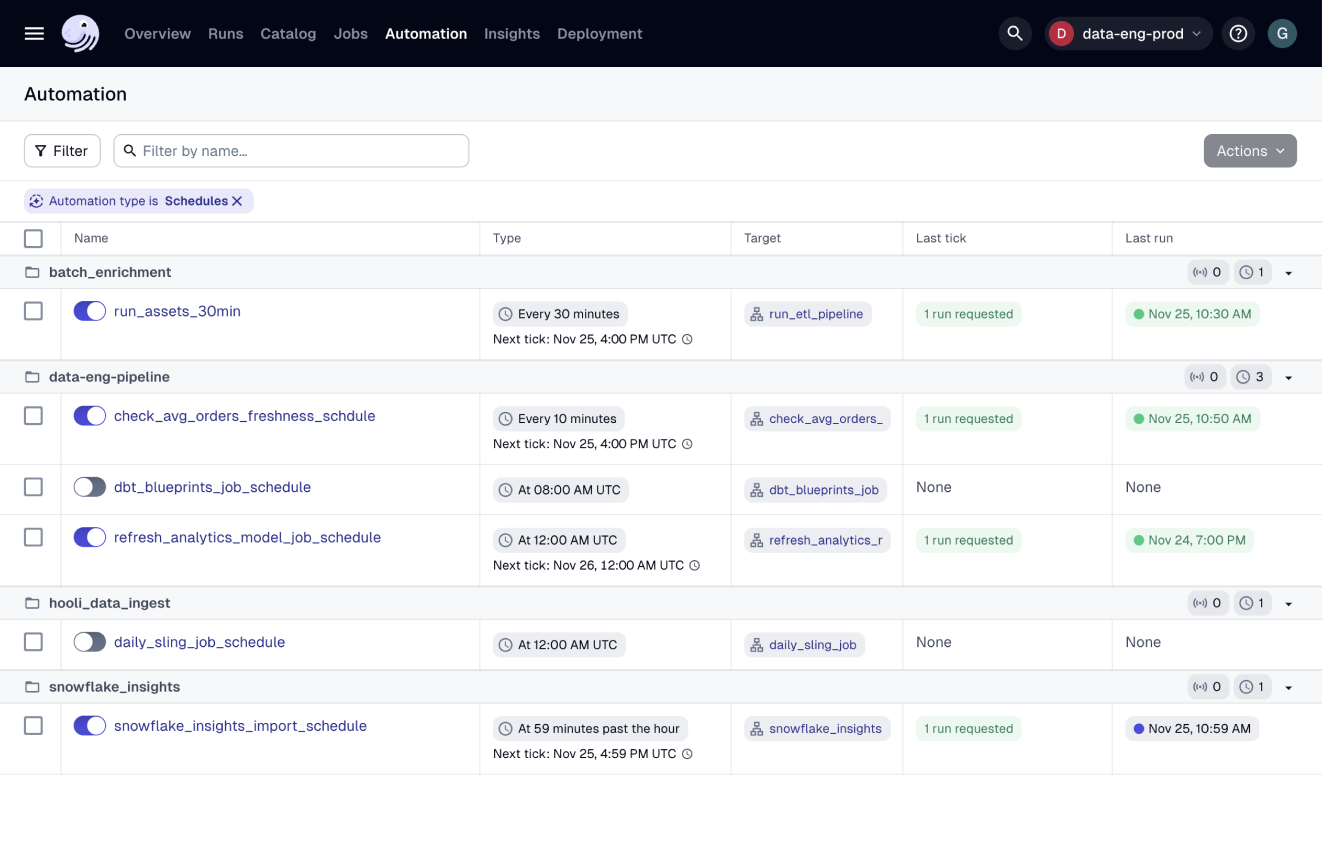
Schedules
- All schedules
- Schedule details
The Schedules page lists all schedules defined in your Dagster deployment, as well as information about upcoming ticks for anticipated scheduled runs. Click a schedule to open the Schedule details page.
To access the schedules page, click Overview (top nav) > Schedules tab.
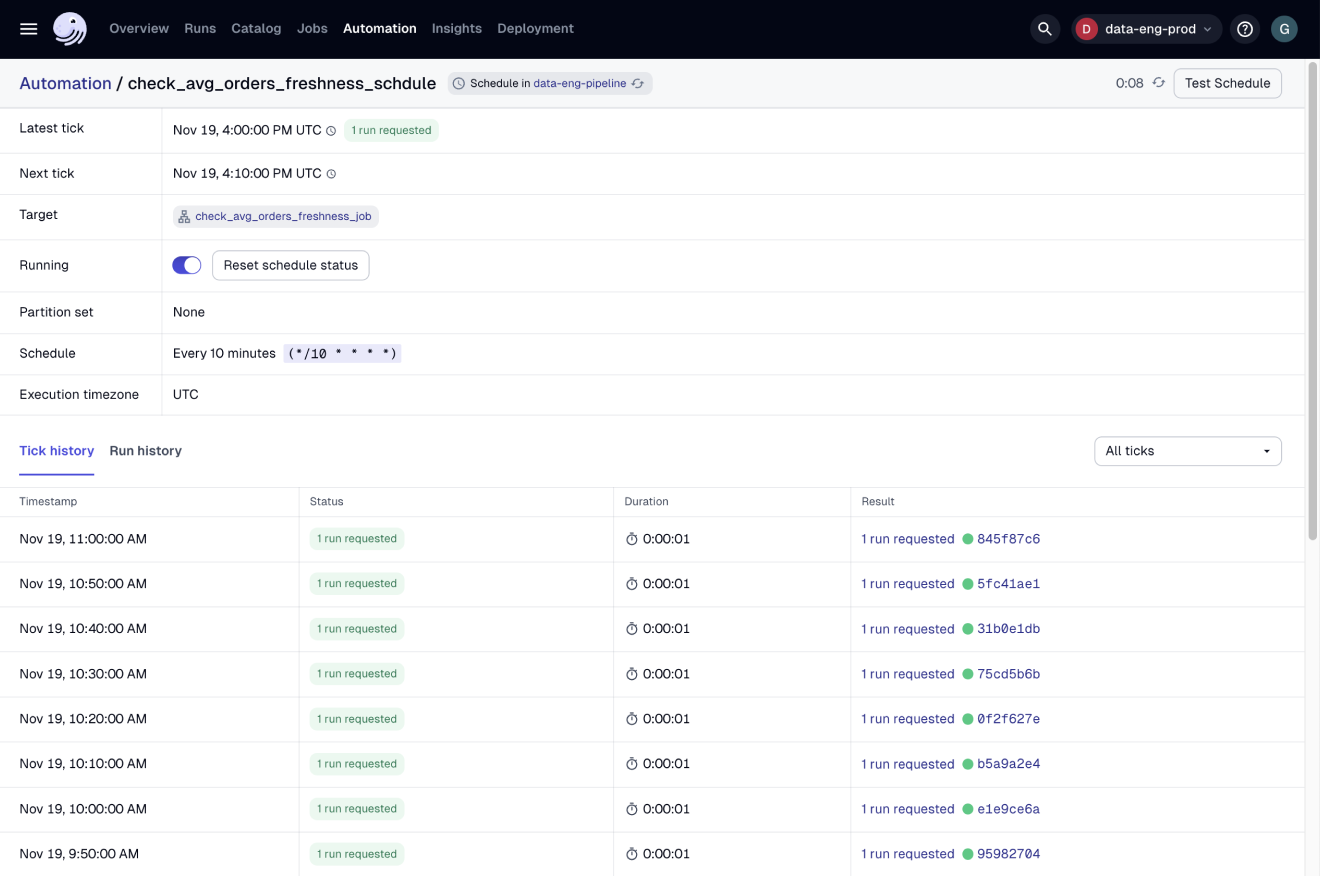
Schedule details
The Schedule details page contains details about a single schedule, including its next tick, tick history, and run history. Clicking the Preview tick result button near the top right corner of the page allows you to test the schedule.
To access the schedule details page, click a schedule in the Schedules page.
Sensors
- All sensors
- Sensor details
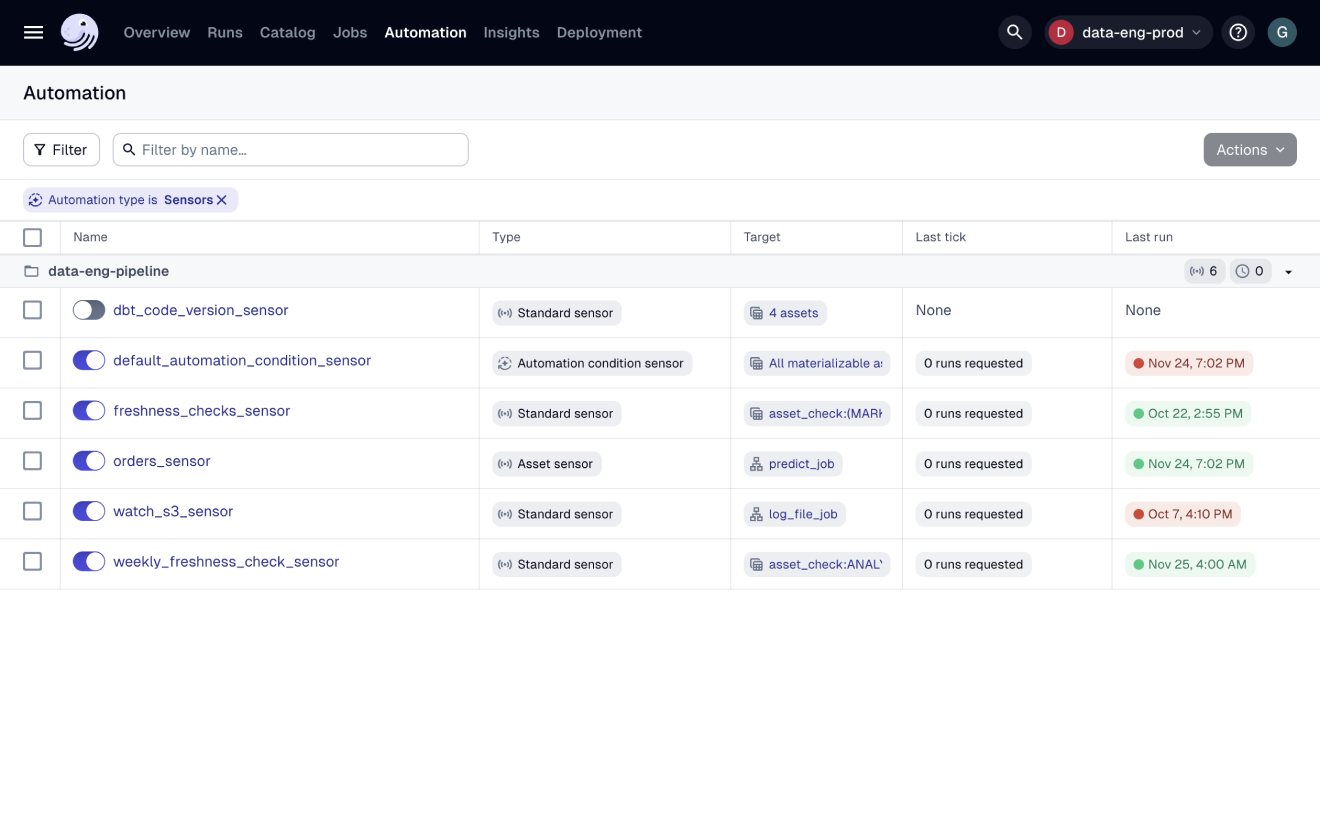
The Sensors page lists all sensors defined in your Dagster deployment, as well as information about the sensor's frequency and its last tick. Click a sensor to view details about the sensor, including its recent tick history and recent runs.
To access the sensors page, click Overview (top nav) > Sensors tab.
Sensor details
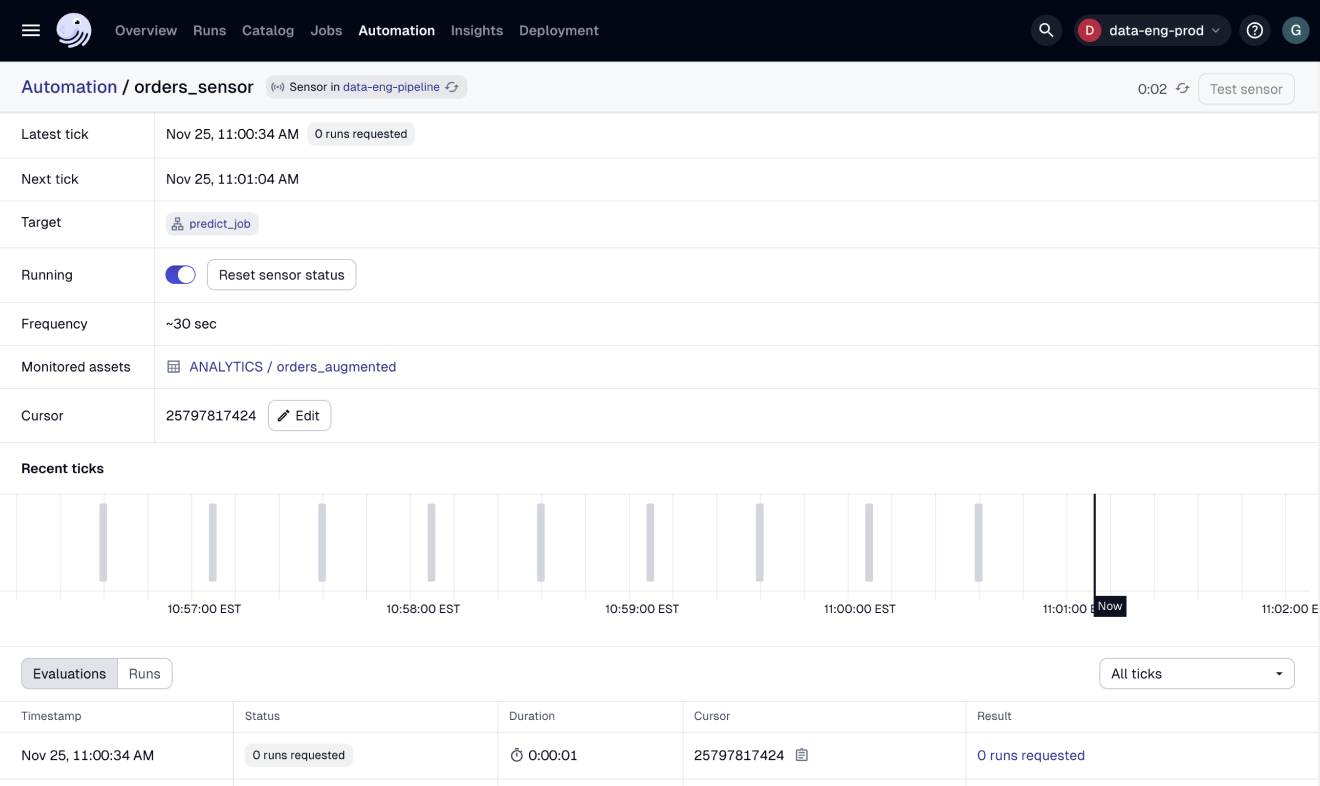
- Description: The Sensor details page contains details about a single sensor, including its next tick, tick history, and run history. Clicking the Preview tick result button near the top right corner of the page allows you to test the sensor.
To access sensor details, click a sensor on the Sensors page.
Resources
- All resources
- Resource details
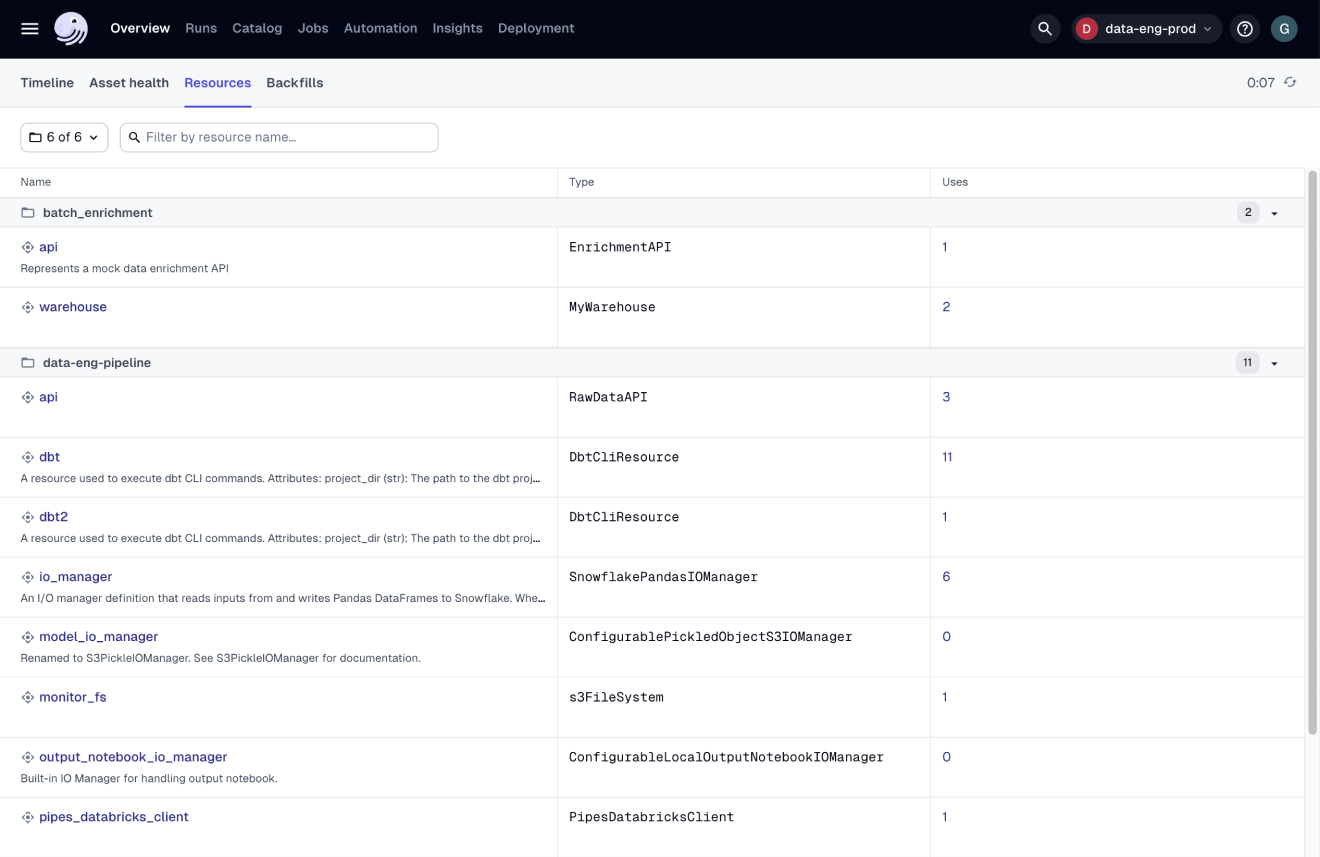
The Resources page lists all resources defined in your Dagster deployment, across all code locations. Clicking a resource will open the Resource details page.
To access the resources page, click Overview (top nav) > Resources tab.
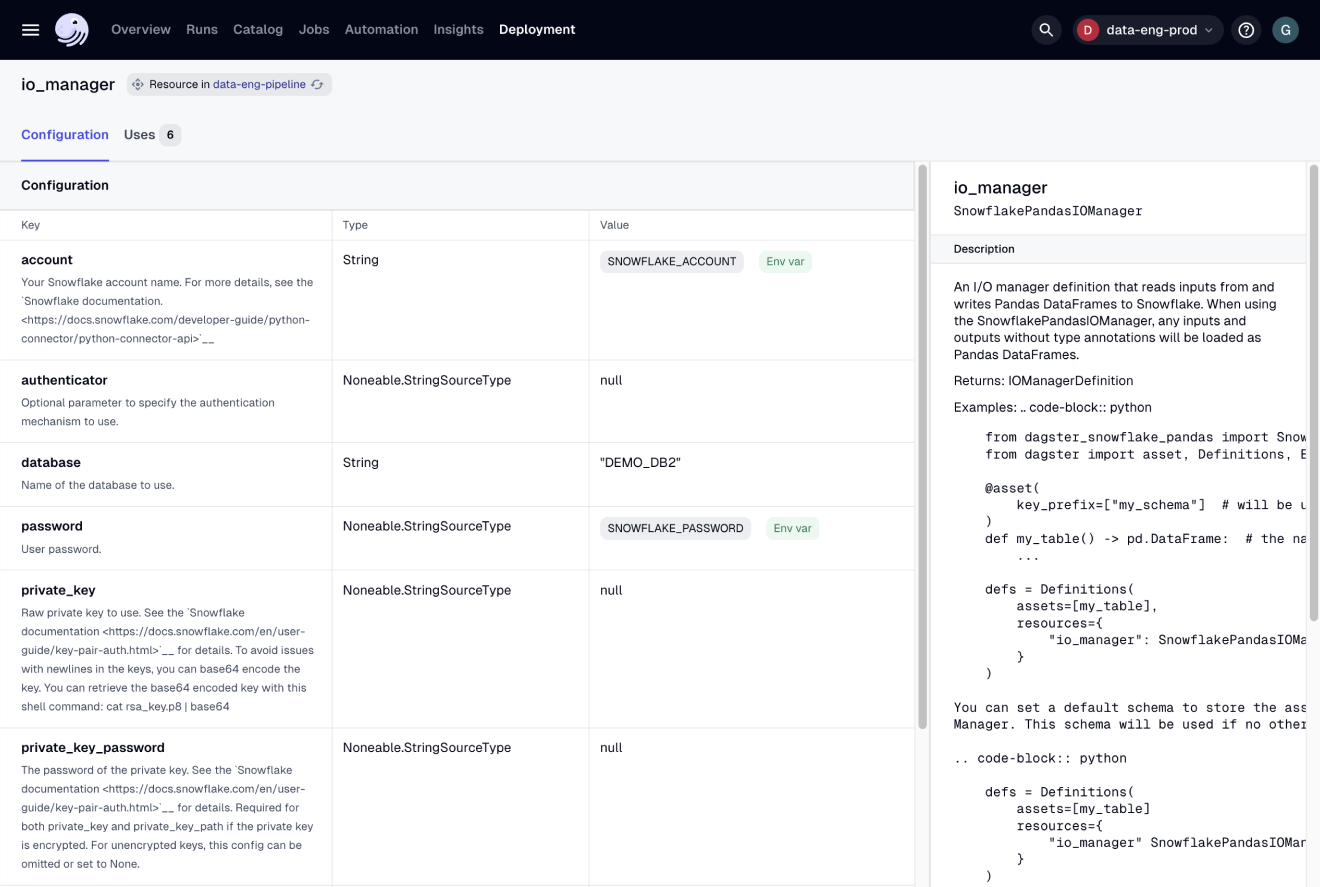
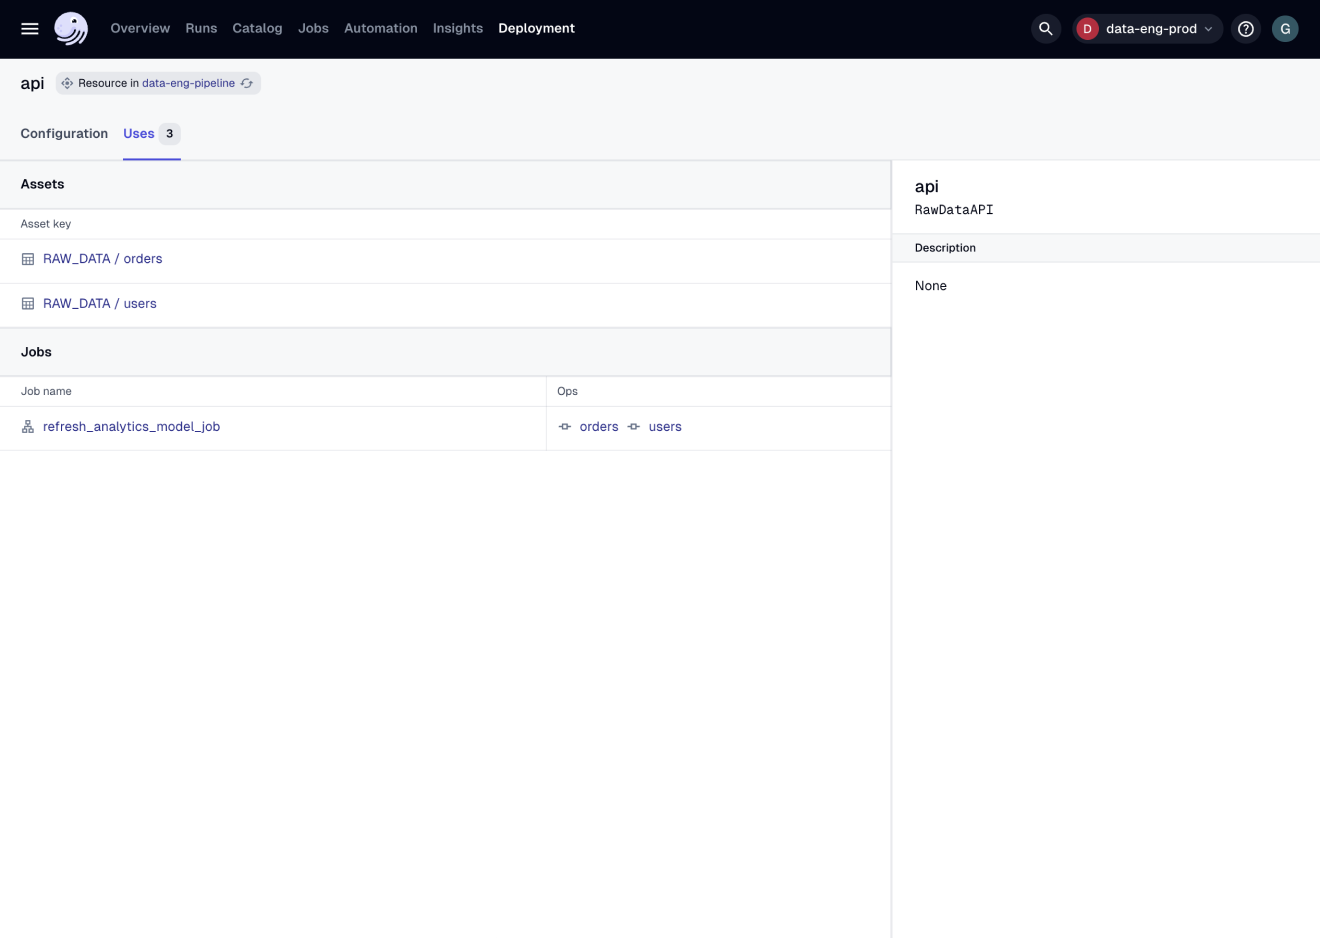
The Resource details page contains detailed information about a resource, including its configuration, description, and uses. Click the tabs below for more information about the tabs on this page.
To access the resource details page, click a resource on the Resources page.
- Configuration tab
- Uses tab
The Configuration tab contains detailed information about a resource's configuration, including the name of each key, type, and value of each config value. If a key's value is an environment variable, an Env var badge will display next to the value.
To access the configuration tab, on the Resource details page, click the Configuration tab.
Backfills tab
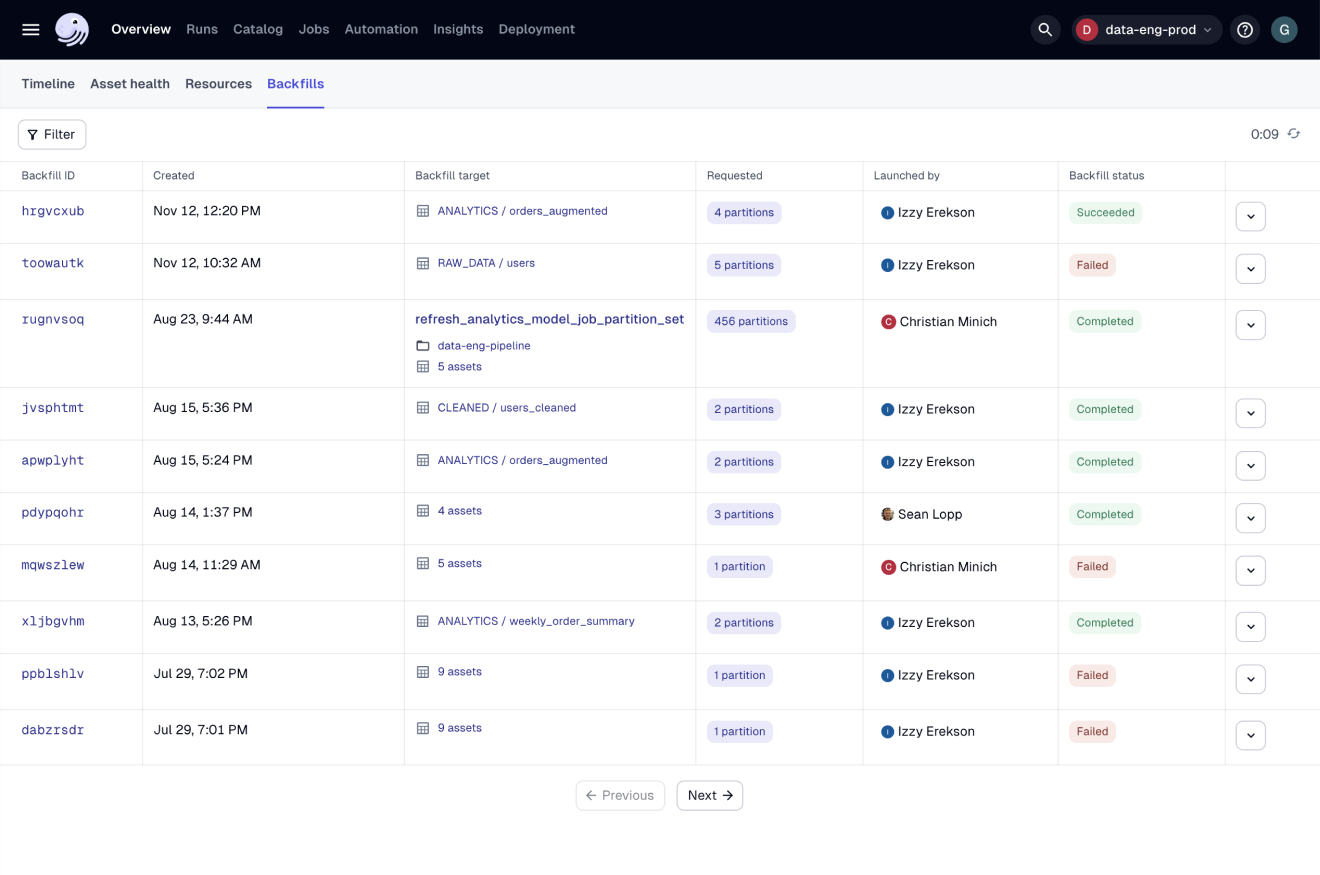
The Backfills tab contains information about the backfills in your Dagster deployment, across all code locations. It includes information about when the partition was created, its target, status, run status, and more.
To access the backfills tab, click Overview (top nav) > Backfills tab.
Jobs
- All jobs
- Job details
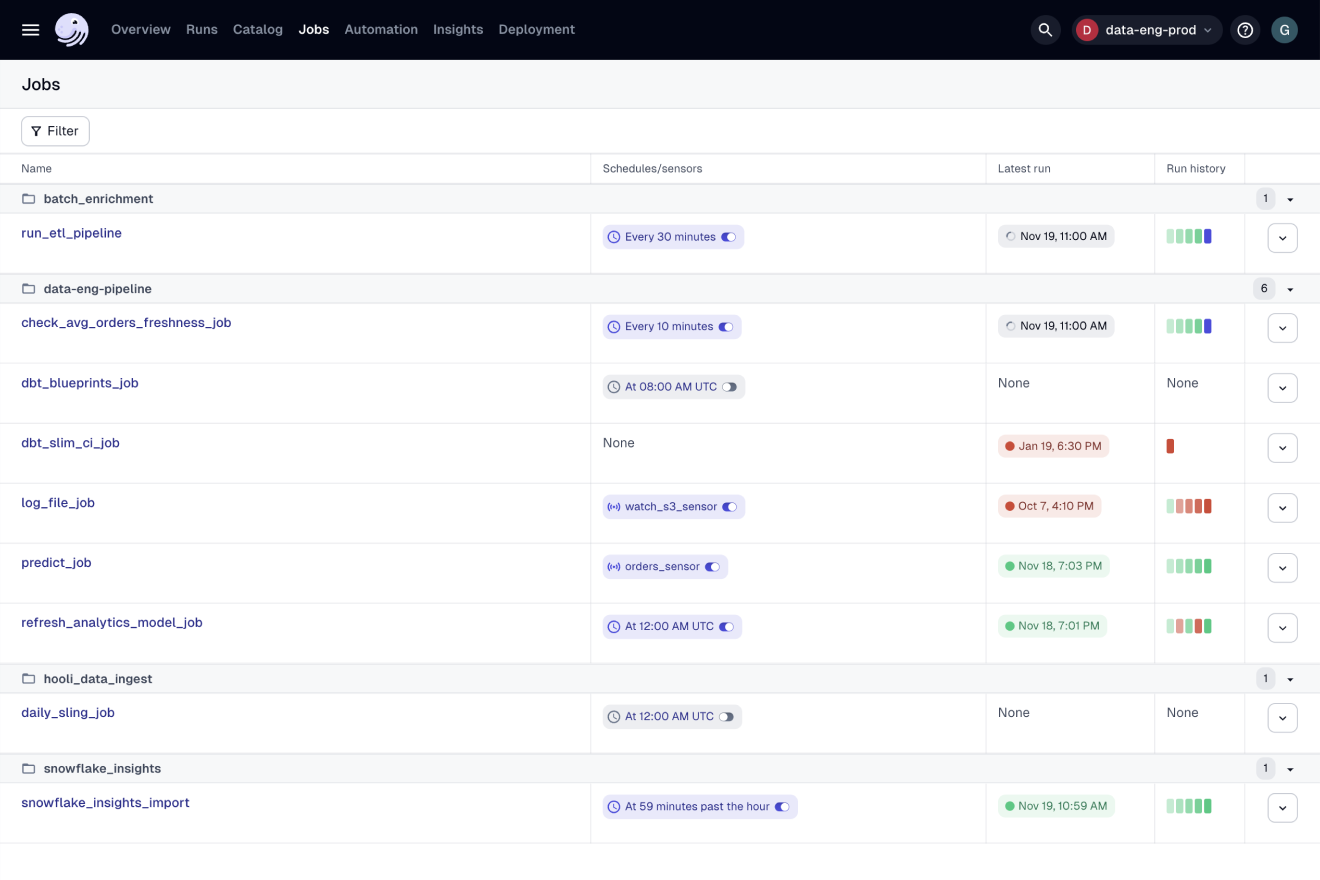
The Jobs page lists all jobs defined in your Dagster deployment across all code locations. It includes information about the job's schedule or sensor, its latest run time, and its history. Click a job to open the Job details page.
To access the jobs page, click Overview (top nav) > Jobs tab.
The Job details page contains detailed information about a job. Click the tabs below for more information about the tabs on this page.
To access job details, click a job in the Jobs page.
- Overview tab
- Launchpad tab
- Runs tab
- Partitions tab
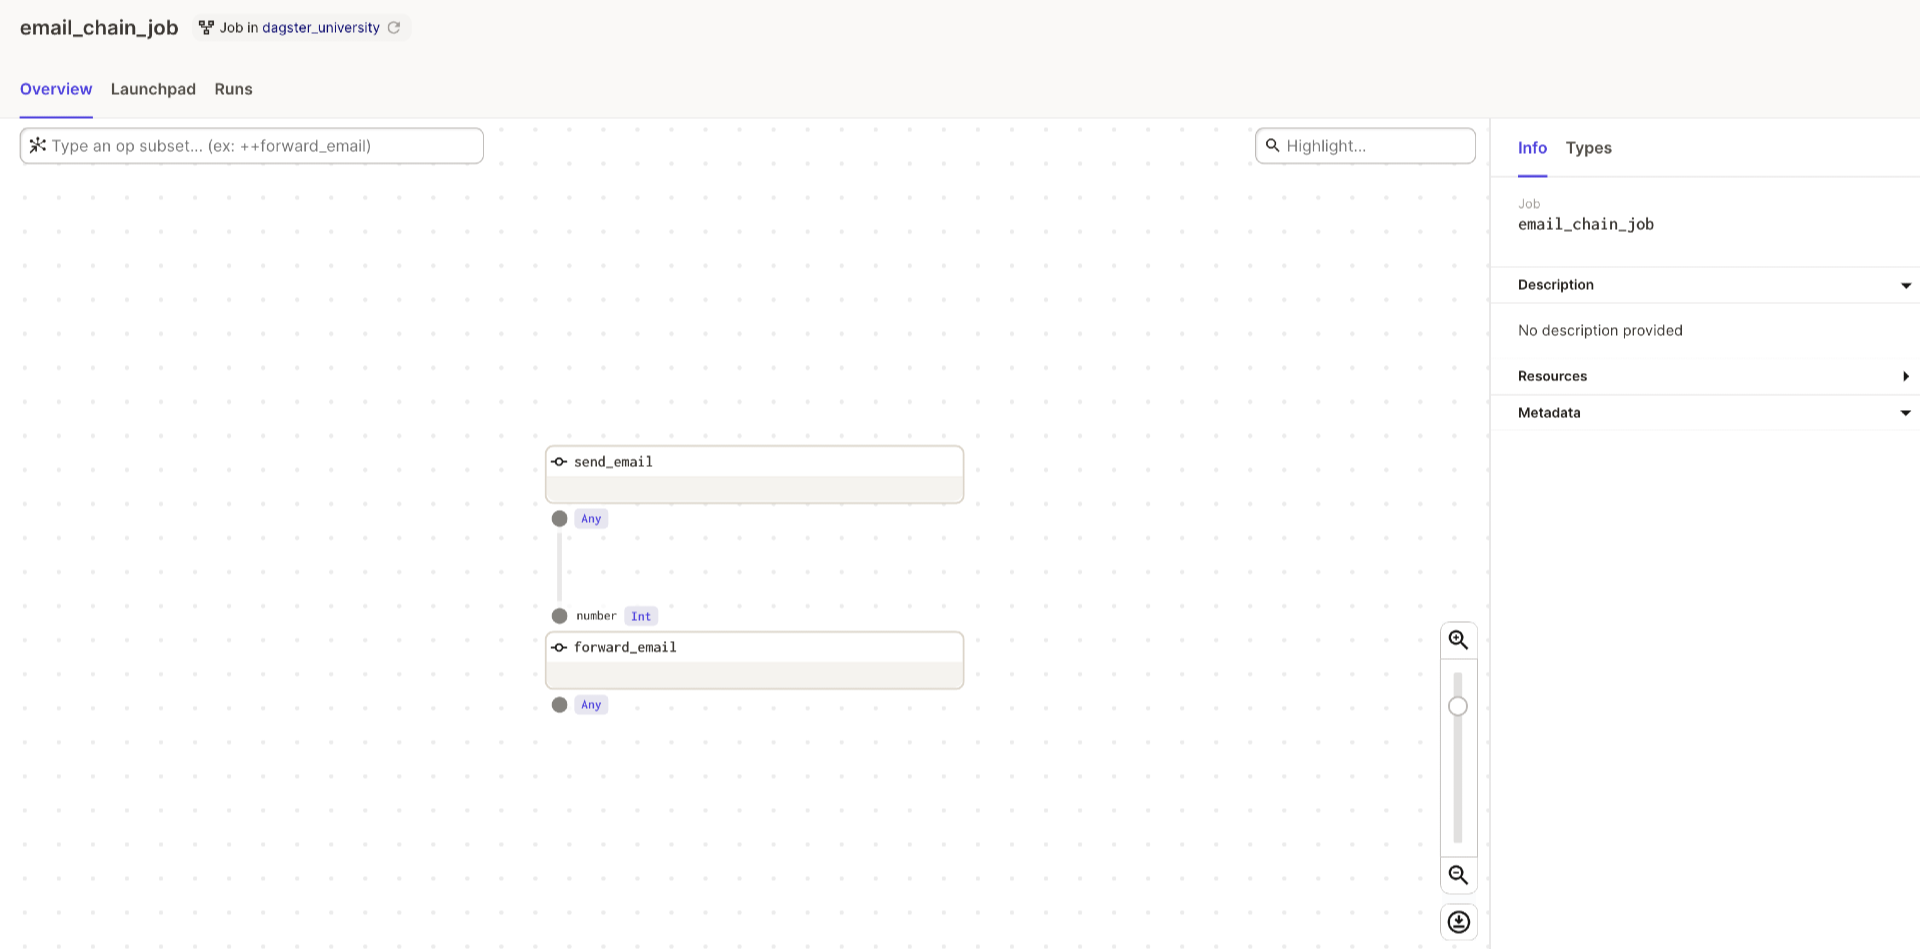
The Overview tab in the Job details page shows the graph of assets and/or ops that make up a job.
To access the overview tab, on the Job details page, click the Overview tab.
The Launchpad tab provides a configuration editor to let you experiment with configuration and launch runs.
To access the launchpad tab, on the Job details page, click the Launchpad tab.
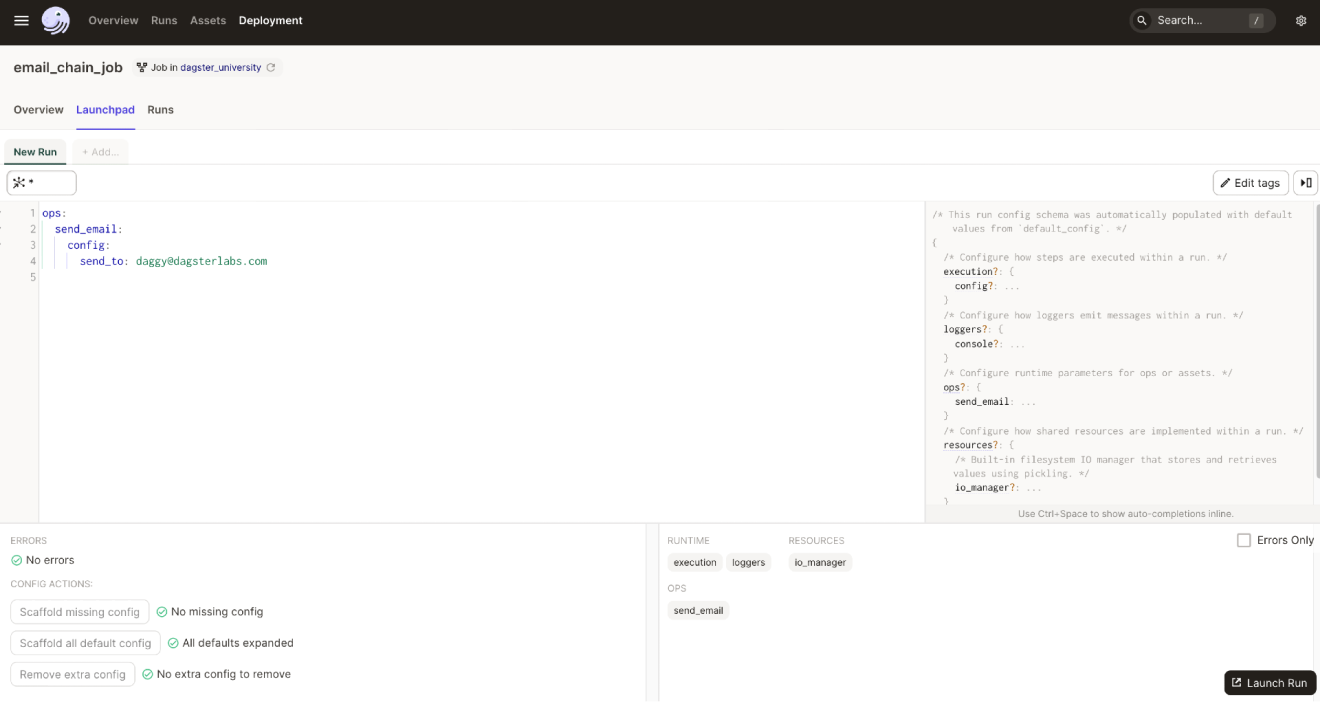
For assets, this tab will only display if a job requires config. It displays by default for all op jobs.
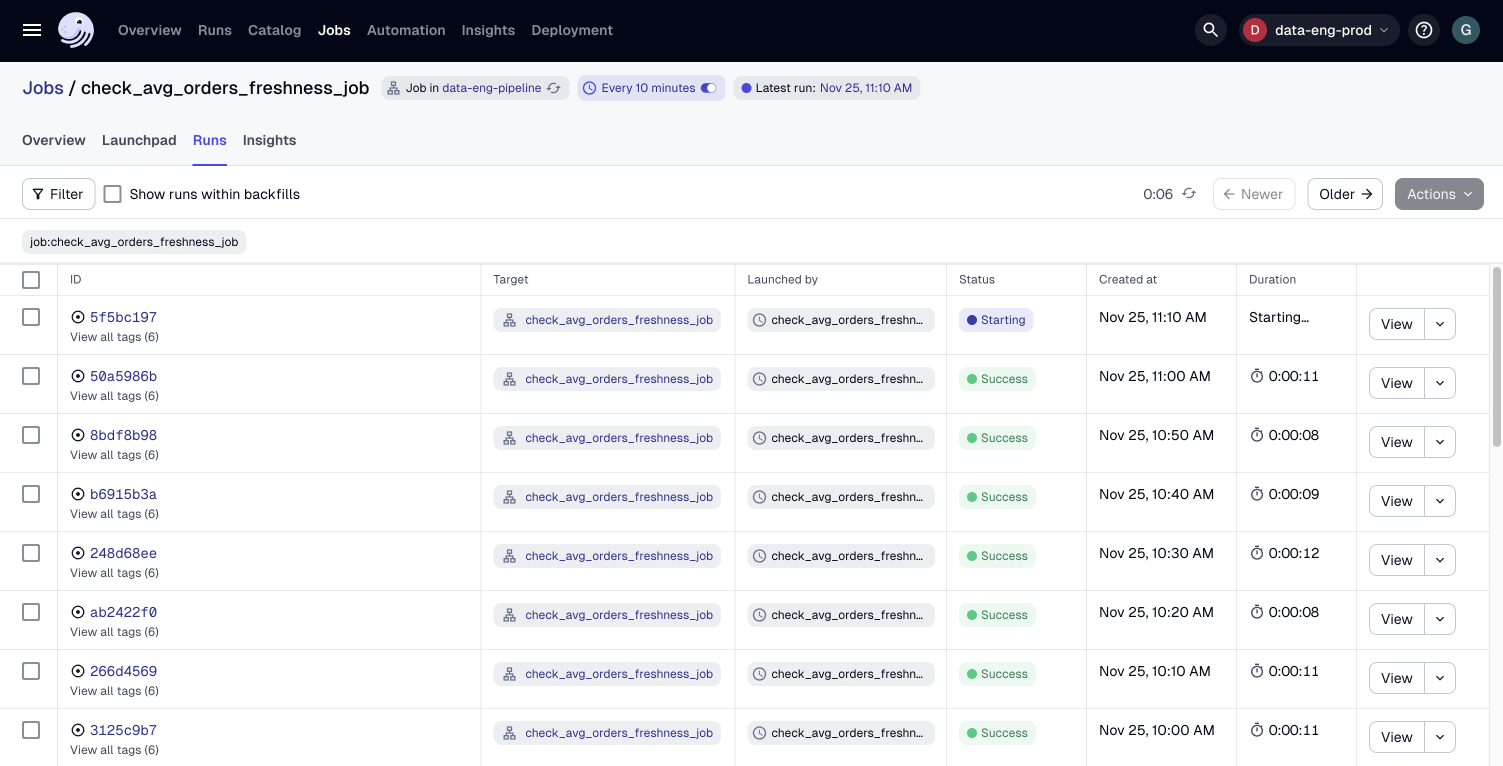
The Runs tab displays a list of recent runs for a job. Clicking a run will open the Run details page.
To access the runs tab, on the Job details page, click the Runs tab.
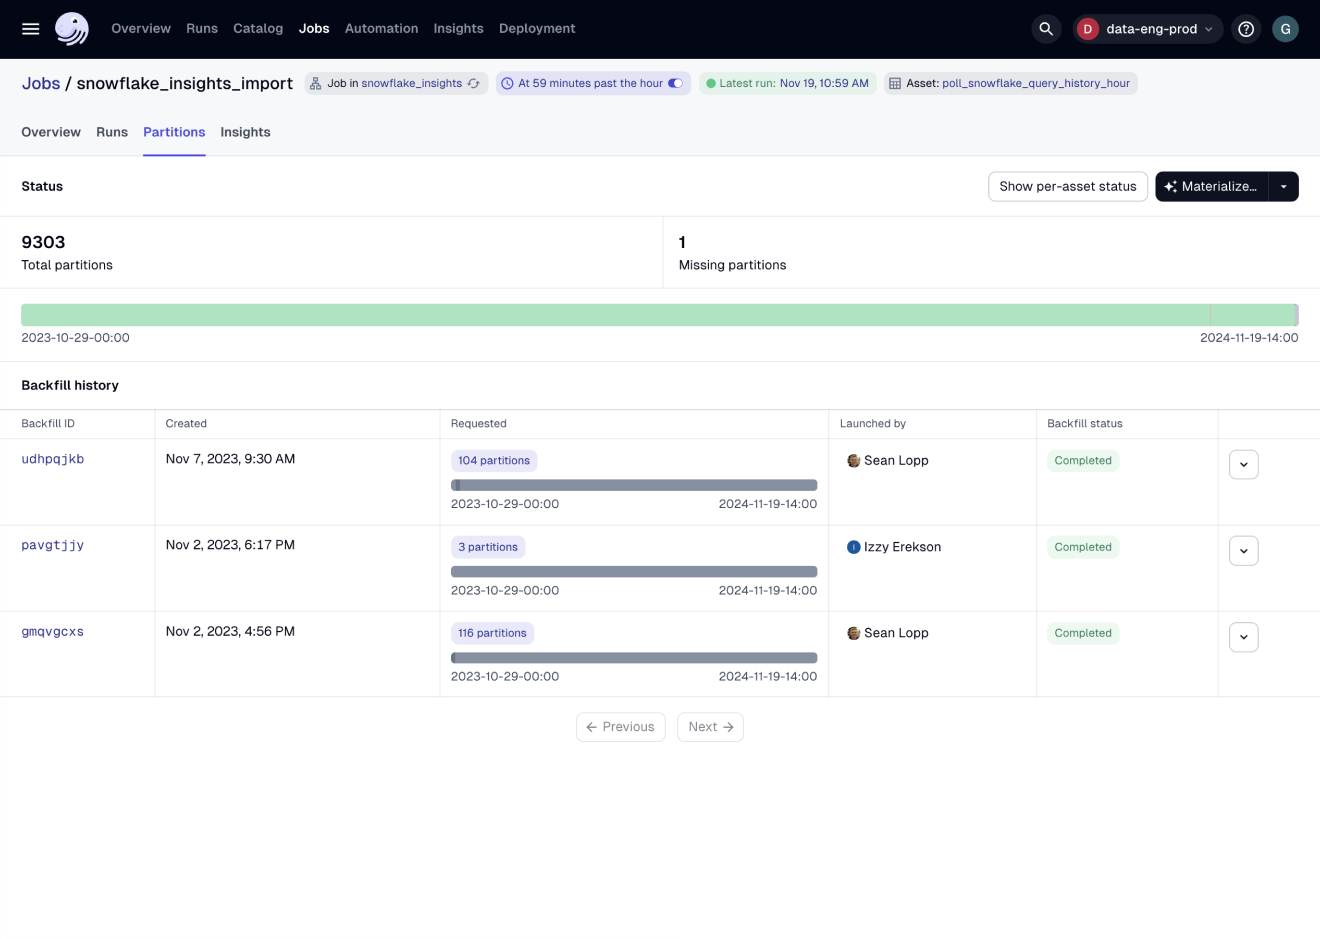
The Partitions tab displays information about the partitions associated with the job, including the total number of partitions, the number of missing partitions, and the job's backfill history.
This tab will display only if the job contains partitions.
To access the partitions tab, on the Job details page, click the Partitions tab.
Deployment
The Deployment page includes information about the status of the code locations in your Dagster deployment, daemon (Open Source) or agent (Cloud) health, schedules, sensors, and configuration details.
- Code locations tab
- Open Source (OSS)
- Dagster+
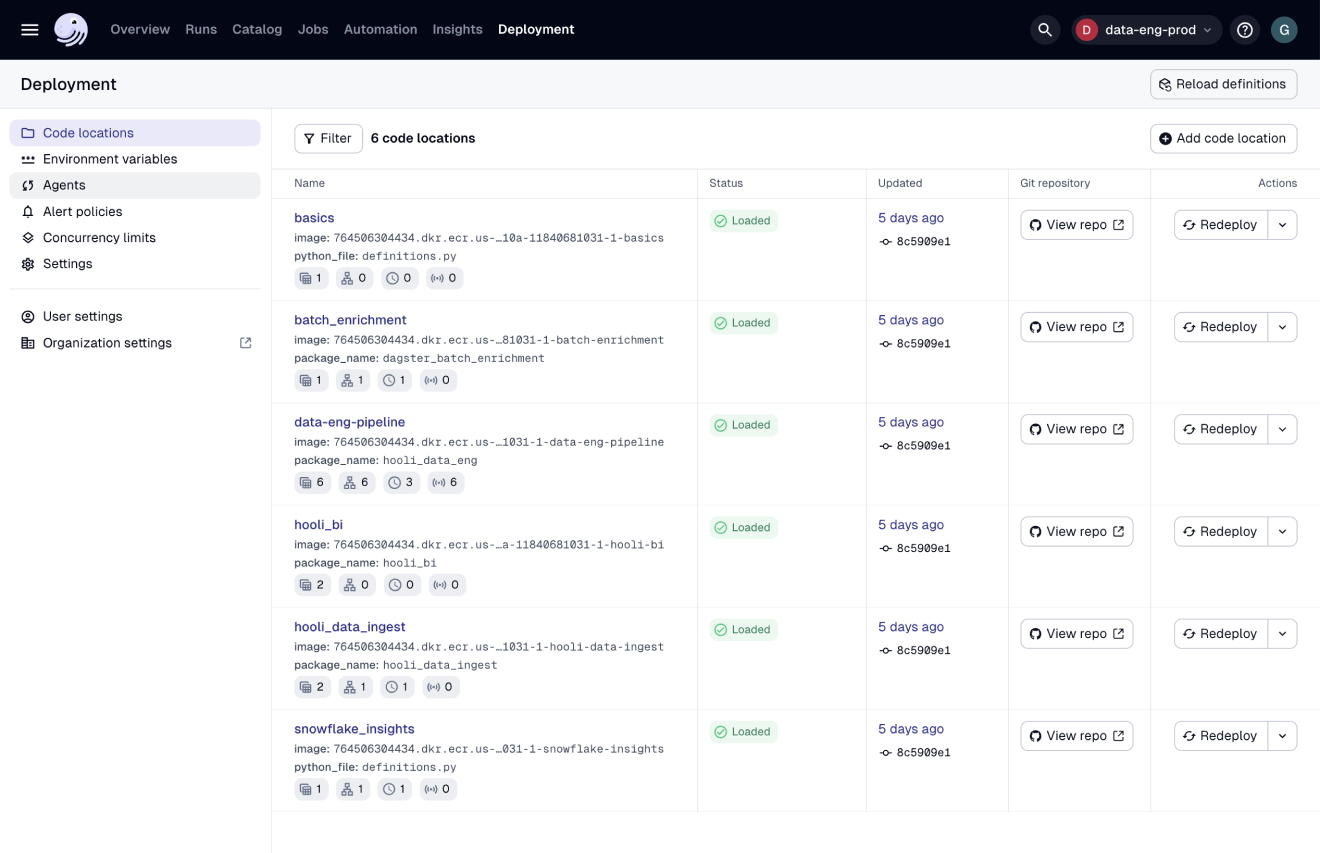
The Code locations tab contains information about the code locations in your Dagster deployment, including their current status, when they were last updated, and high-level details about the definitions they contain.
You can reload Dagster definitions by:
- Clicking Reload all to reload all definitions in all code locations
- Clicking Reload next to a specific code location to reload only that code location's definitions
To access the code locations tab:
- Click Deployment in the top navigation bar.
- On the Deployment overview page, click the Code locations tab.
In addition to the Code locations tab, Dagster OSS deployments contain a few additional tabs. For more information, see the tabs below.
- Daemons tab
- Configuration tab
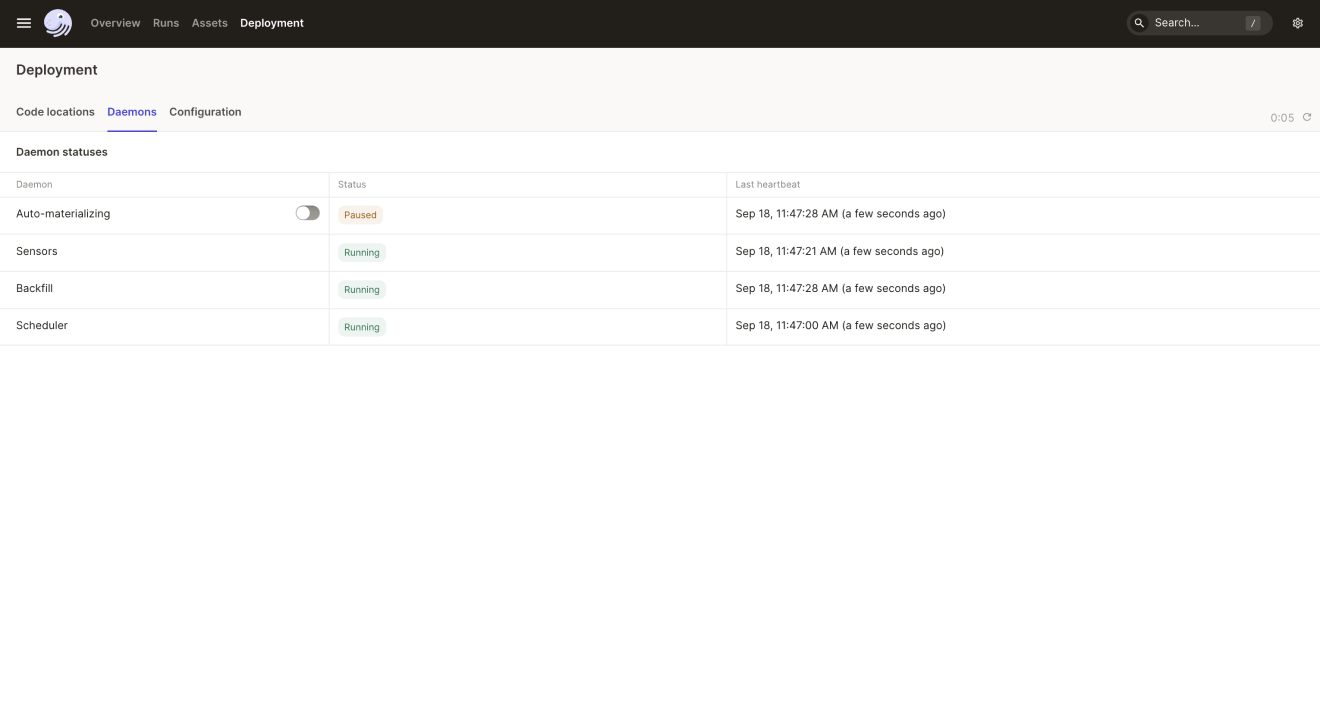
The Daemons tab contains information about the daemons in an Open Source Dagster deployment, including their current status and when their last heartbeat was detected.
To access this tab, on the Deployment overview page, click Daemons.
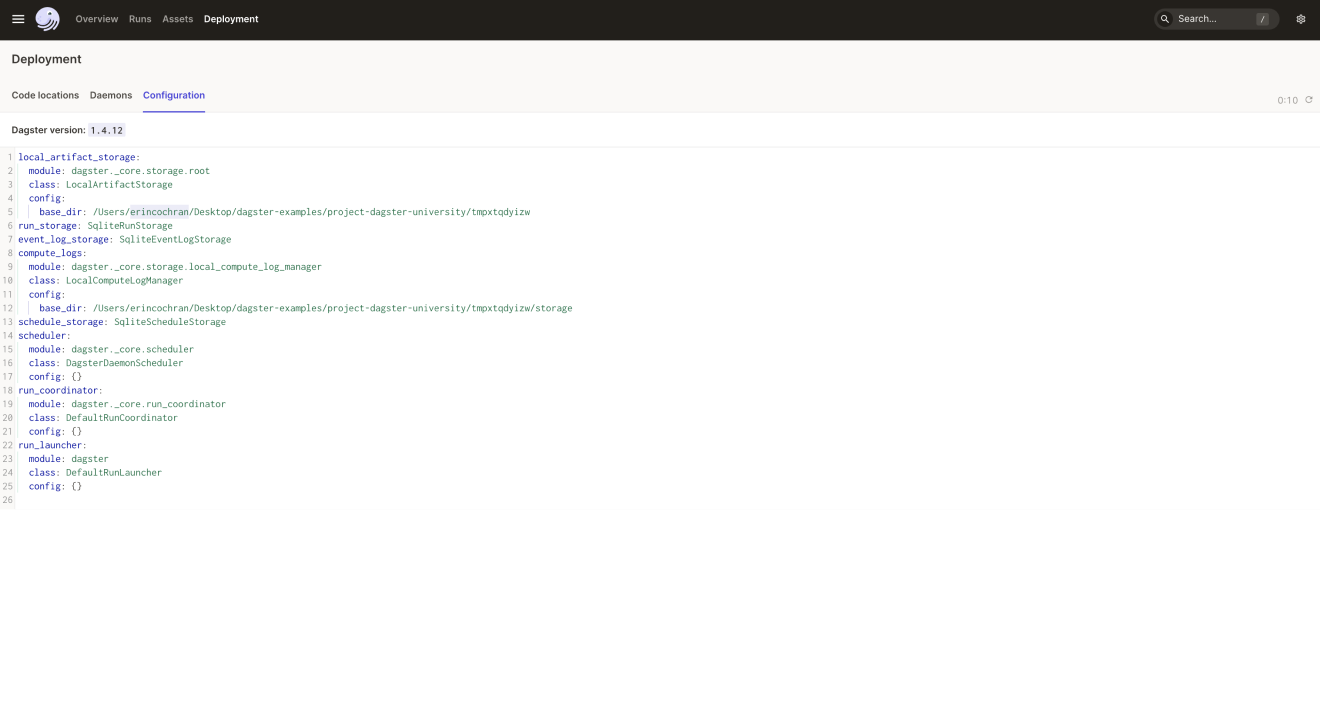
The Configuration tab displays information about the configuration for a Dagster deployment, which is managed through the dagster.yaml file.
To access this tab, on the Deployment overview page, click the Configuration tab.
In addition to the Code locations tab, Dagster+ deployments contain a few additional tabs. For more information, see the tabs below.
- Agents tab
- Environmental variables tab
- Alerts tab
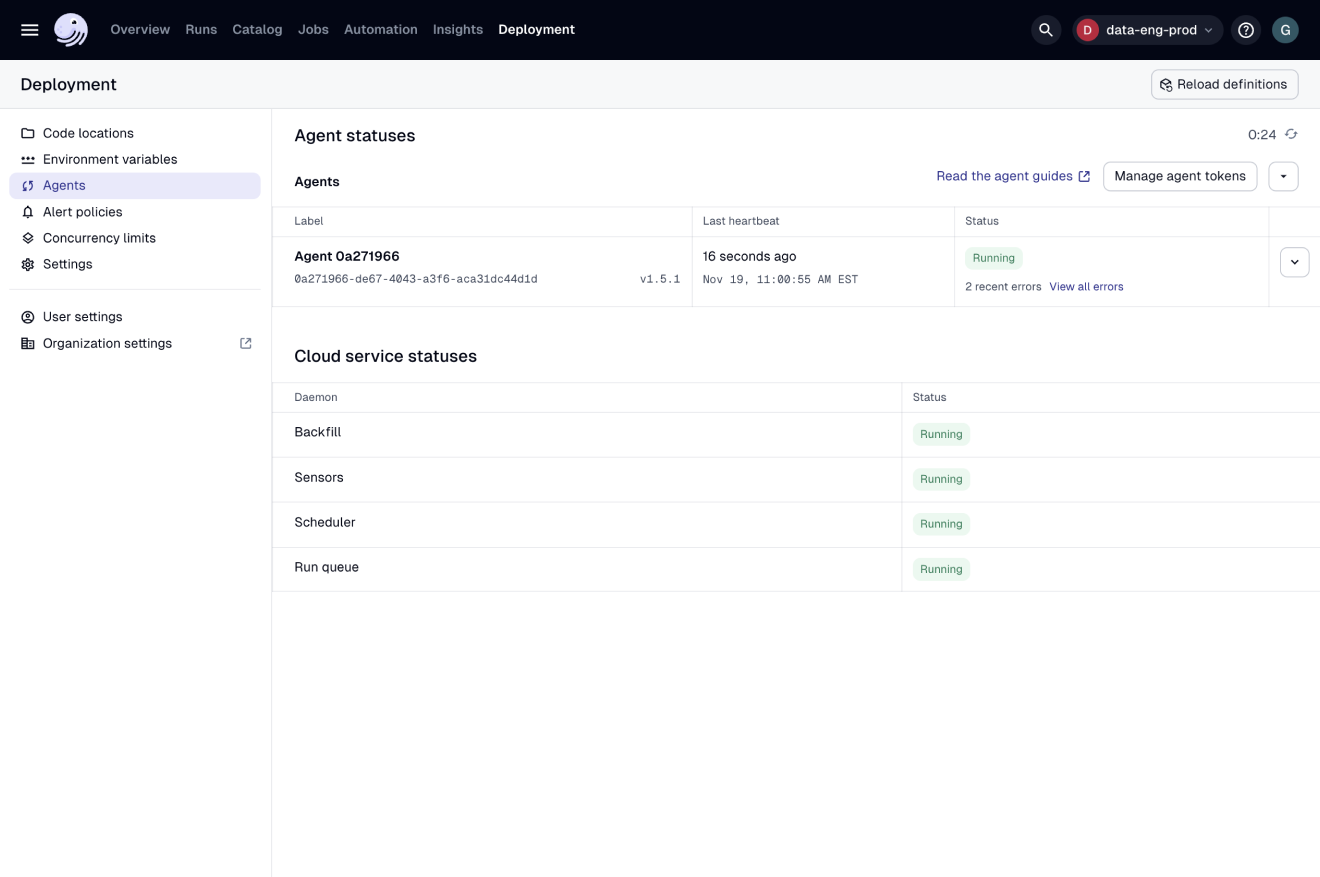
The Agents tab contains information about the agents in a Dagster+ deployment.
To access this tab, on the Deployment overview page, click the Agents tab.
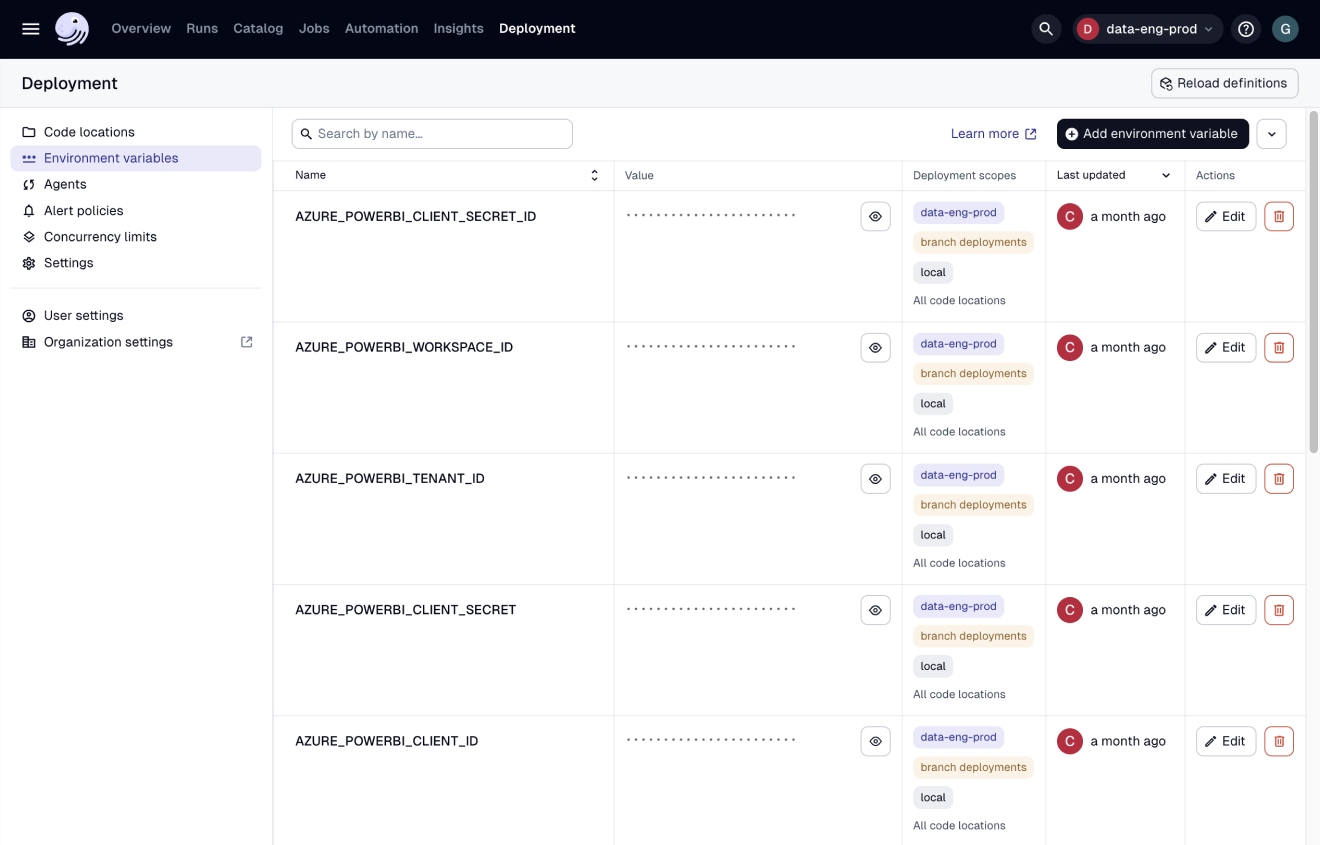
The Environment variables tab contains information about the environment variables configured in a Dagster+ deployment. For more information, see the Dagster+ environment variables documentation.
To access this tab, on the Deployment overview page, click the Environment variables tab.
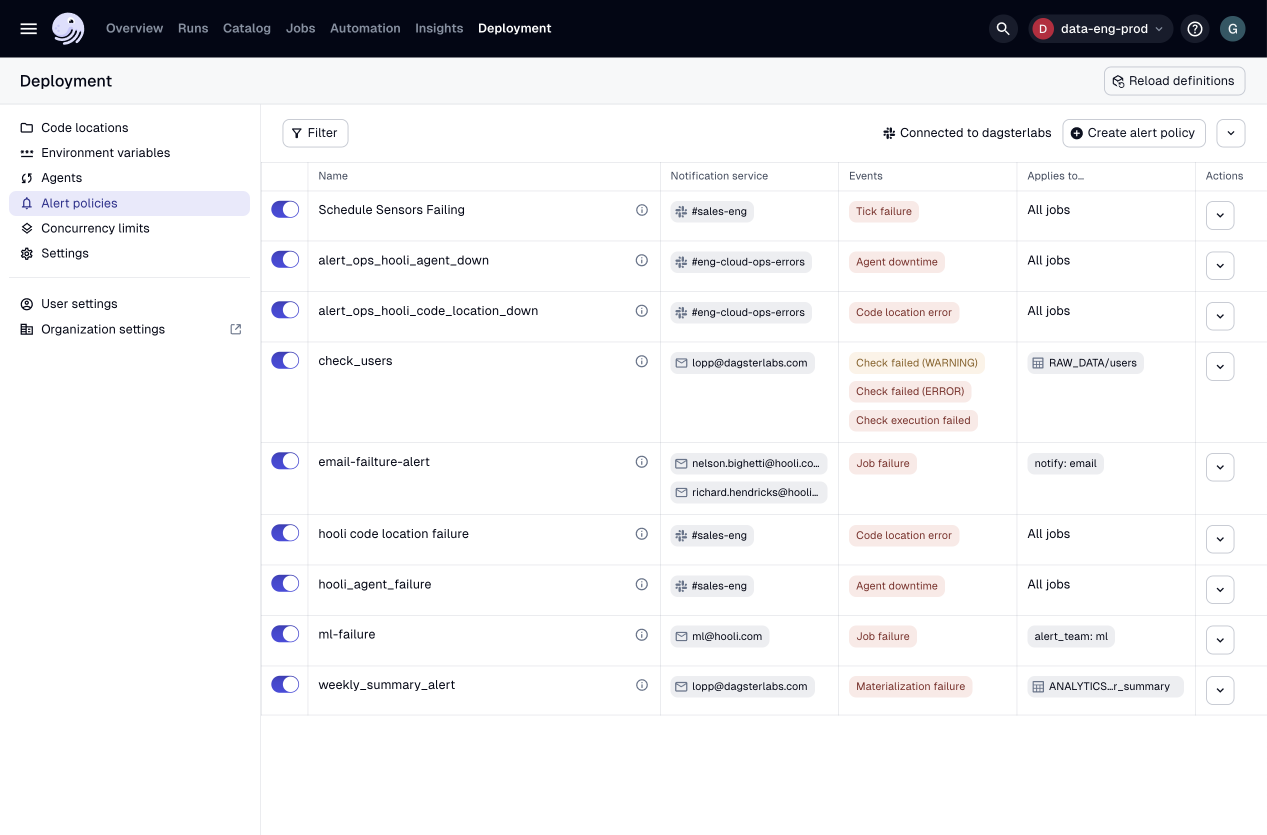
The Alerts tab contains information about the alert policies configured for a Dagster+ deployment. For more information, see the Dagster+ alerts documentation.
To access this tab, on the Deployment overview page, click the Alerts tab.