Logging
Dagster supports a variety of built-in logging options, as well as the ability to extend and customize them. Logs can be produced by runs, sensor and schedule evaluations, and processes like the Dagster webserver and daemon.
By default, Dagster automatically tracks and captures all execution events, which includes:
- Information about what Dagster is doing, such as events that occur while Dagster executes a run to materialize an asset.
- Events produced by user code, such as a custom message showing how many records were processed to create an asset.
During these events, logs like the following are generated:
12:40:05 - DEBUG - RUN_START - Started execution of run for "__ASSET_JOB_0".
12:40:05 - DEBUG - ENGINE_EVENT - Executing steps using multiprocess executor: parent process (pid: 86387)
12:40:05 - DEBUG - taxi_zones_file - STEP_WORKER_STARTING - Launching subprocess for "taxi_zones_file".
12:40:07 - DEBUG - STEP_WORKER_STARTED - Executing step "taxi_zones_file" in subprocess.
12:40:07 - DEBUG - taxi_zones_file - RESOURCE_INIT_STARTED - Starting initialization of resources [io_manager].
12:40:07 - DEBUG - taxi_zones_file - RESOURCE_INIT_SUCCESS - Finished initialization of resources [io_manager].
12:40:07 - DEBUG - LOGS_CAPTURED - Capturing logs for process (pid: 86390).
12:40:07 - DEBUG - taxi_zones_file - STEP_START - Started execution of step "taxi_zones_file".
12:40:09 - DEBUG - taxi_zones_file - STEP_OUTPUT - Yielded output "result" of type "Any". (Type check passed).
12:40:09 - DEBUG - __ASSET_JOB_0 - taxi_zones_file - Writing file at: /Users/erincochran/Desktop/dagster-examples/project-dagster-university/tmpfxsoltsc/storage/taxi_zones_file using PickledObjectFilesystemIOManager...
12:40:09 - DEBUG - taxi_zones_file - ASSET_MATERIALIZATION - Materialized value taxi_zones_file.
12:40:09 - DEBUG - taxi_zones_file - HANDLED_OUTPUT - Handled output "result" using IO manager "io_manager"
12:40:09 - DEBUG - taxi_zones_file - STEP_SUCCESS - Finished execution of step "taxi_zones_file" in 1.17s.
12:40:09 - DEBUG - ENGINE_EVENT - Multiprocess executor: parent process exiting after 4.38s (pid: 86387)
12:40:09 - DEBUG - RUN_SUCCESS - Finished execution of run for "__ASSET_JOB_0".
These logs can be exported to a local file or viewed in the Dagster UI.
Log types
When jobs are run, the logs stream back to the UI's Run details page in real time. The UI contains two types of logs: structured event logs and raw compute logs.
Structured event logs
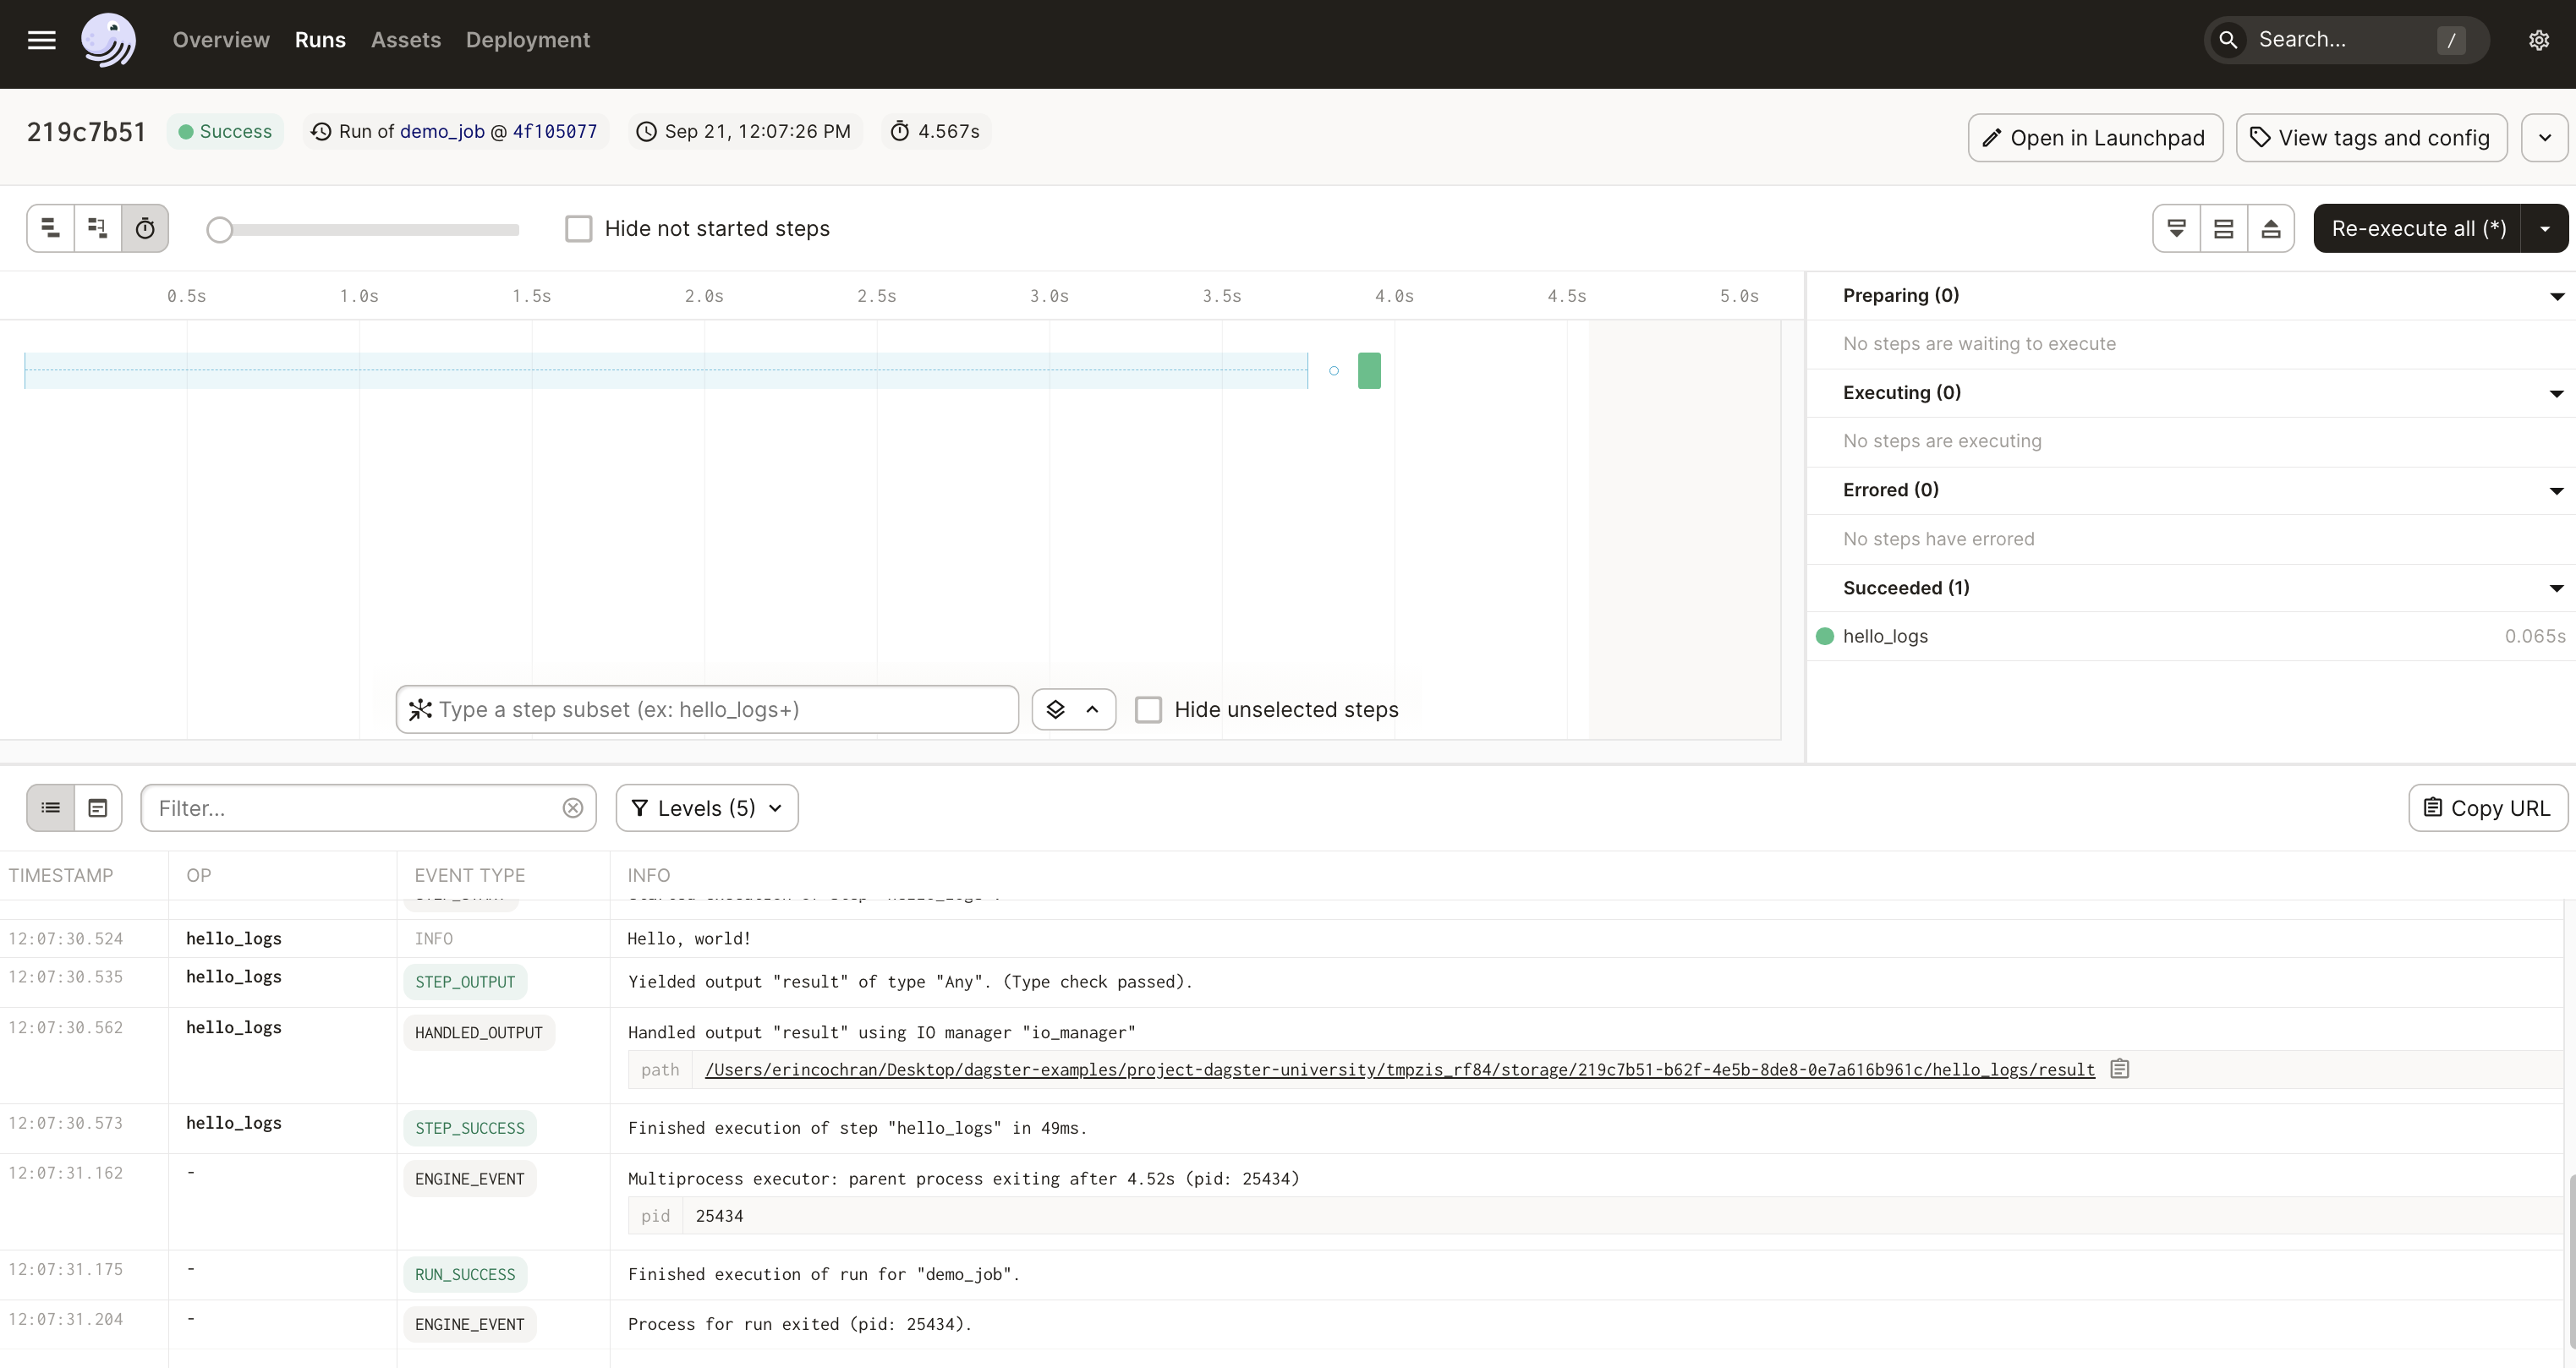
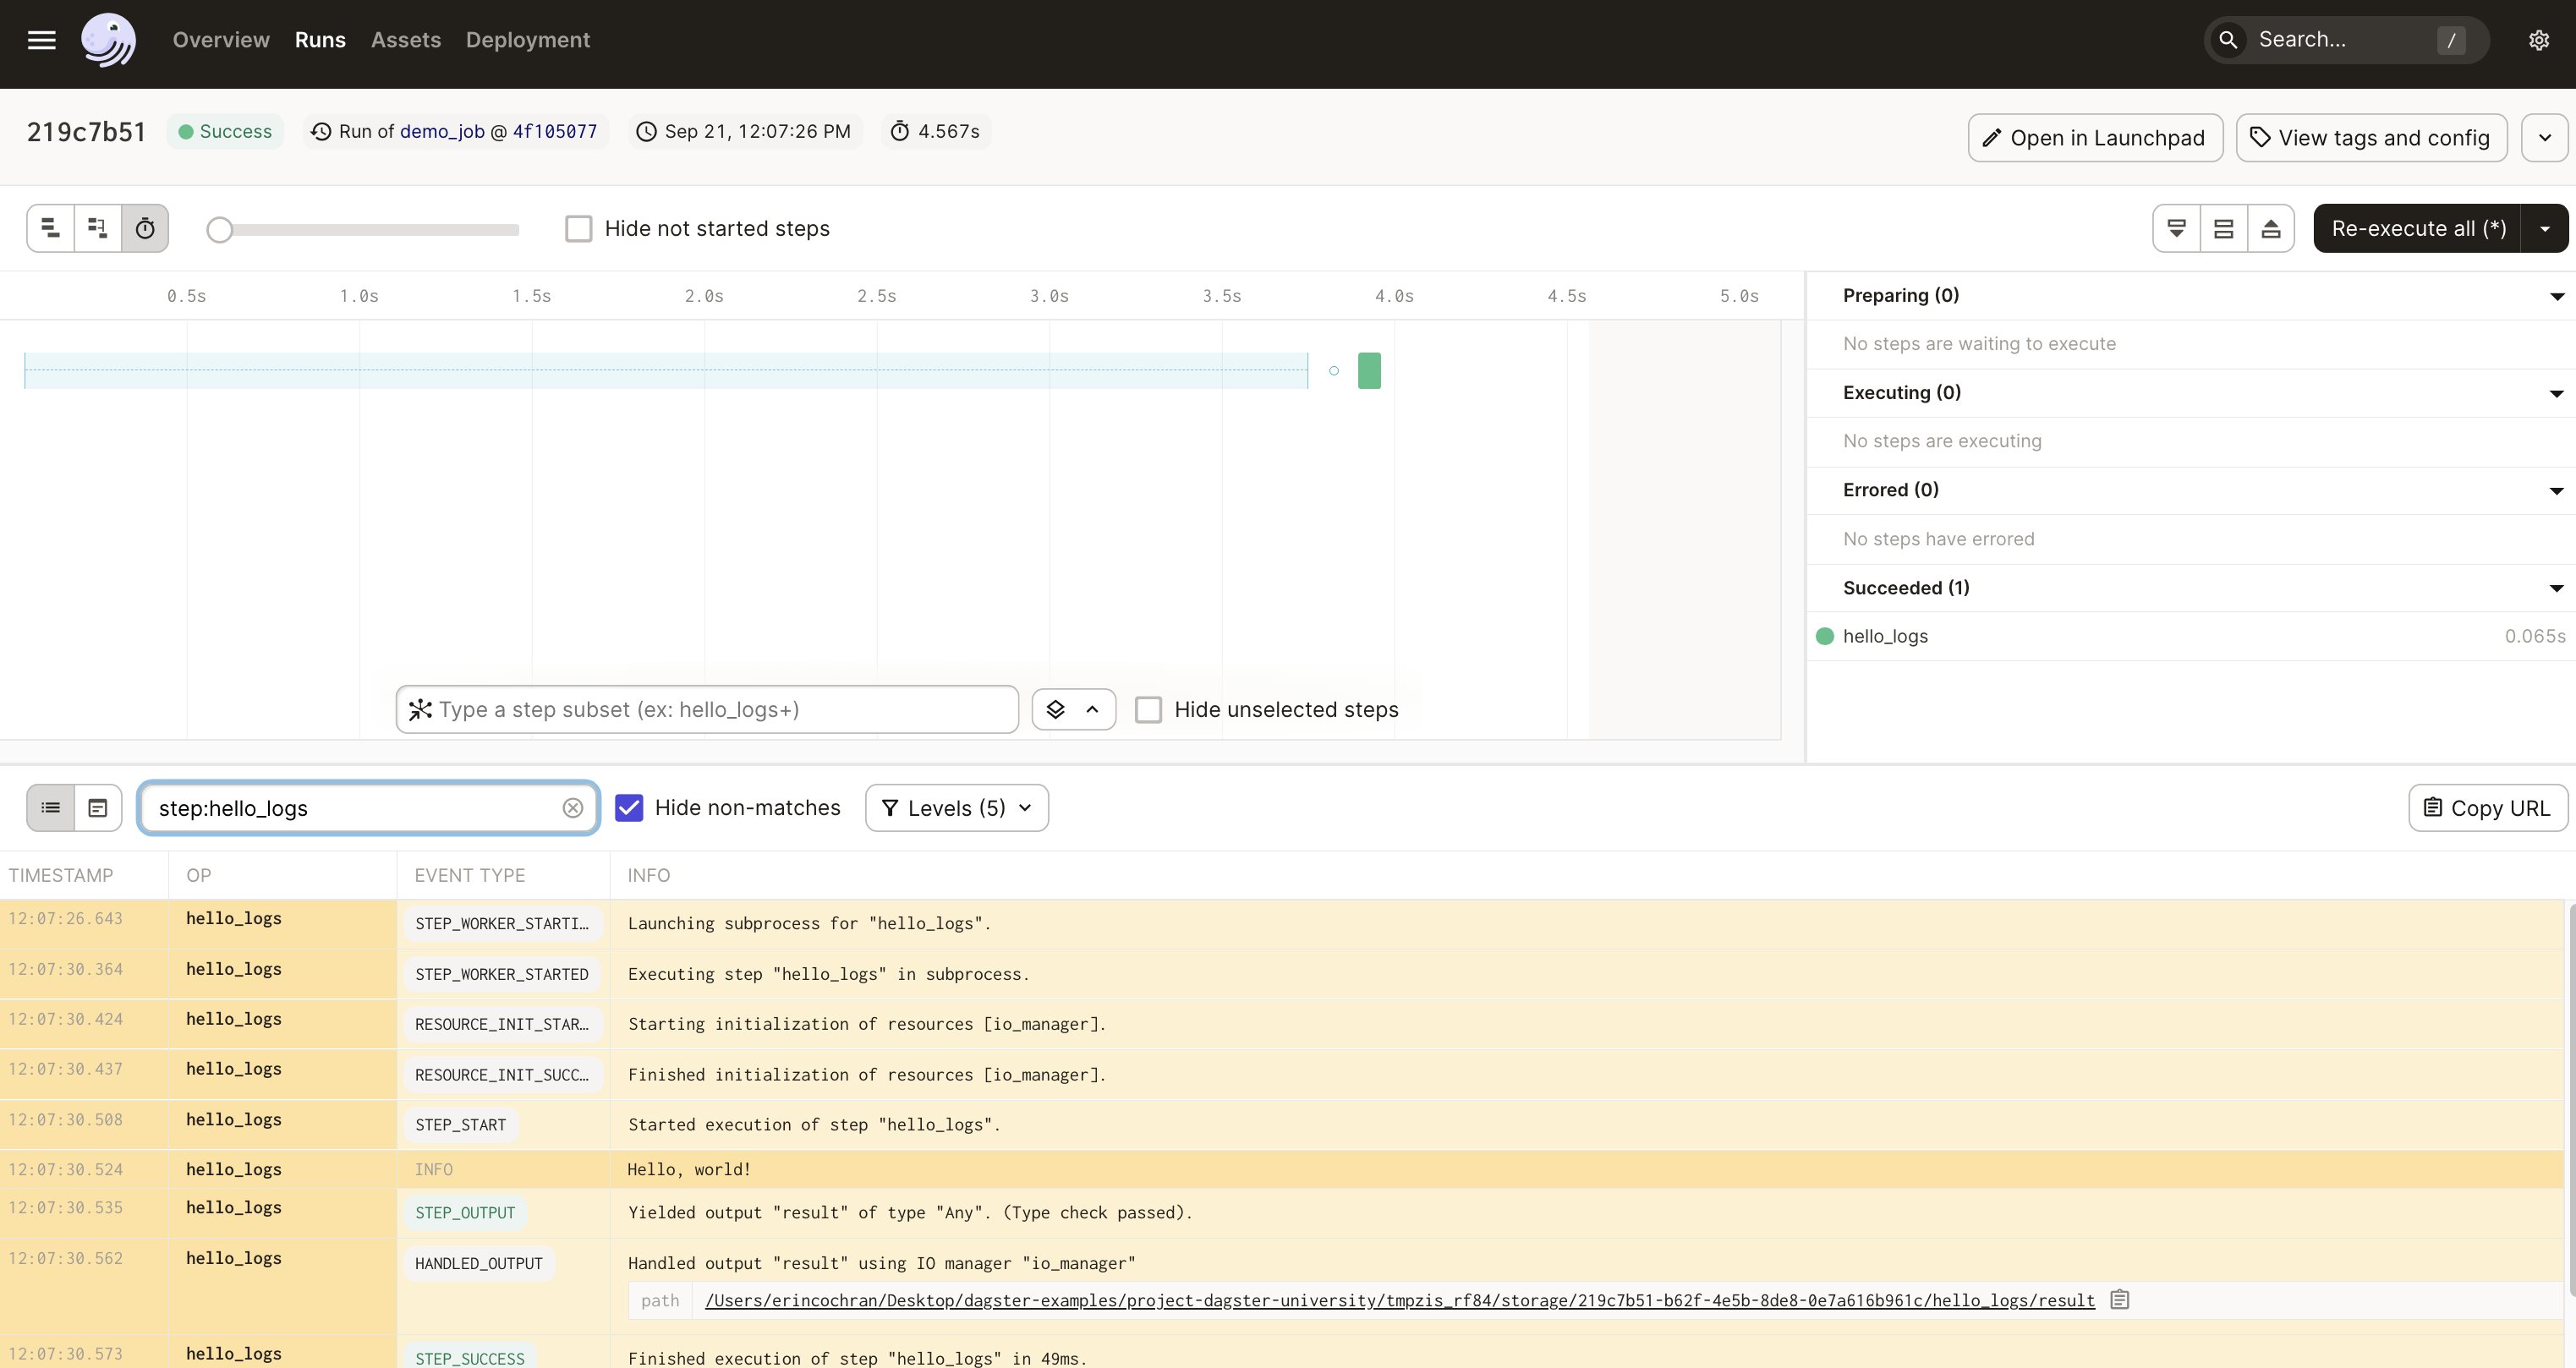
Structured logs are enriched and categorized with metadata. For example, a label of which asset a log is about, links to an asset’s metadata, and what type of event it is available. This structuring also enables easier filtering and searching in the logs.
Logs streaming back to the UI in real time

Log messages filtered based on execution steps and log levels

Raw compute logs
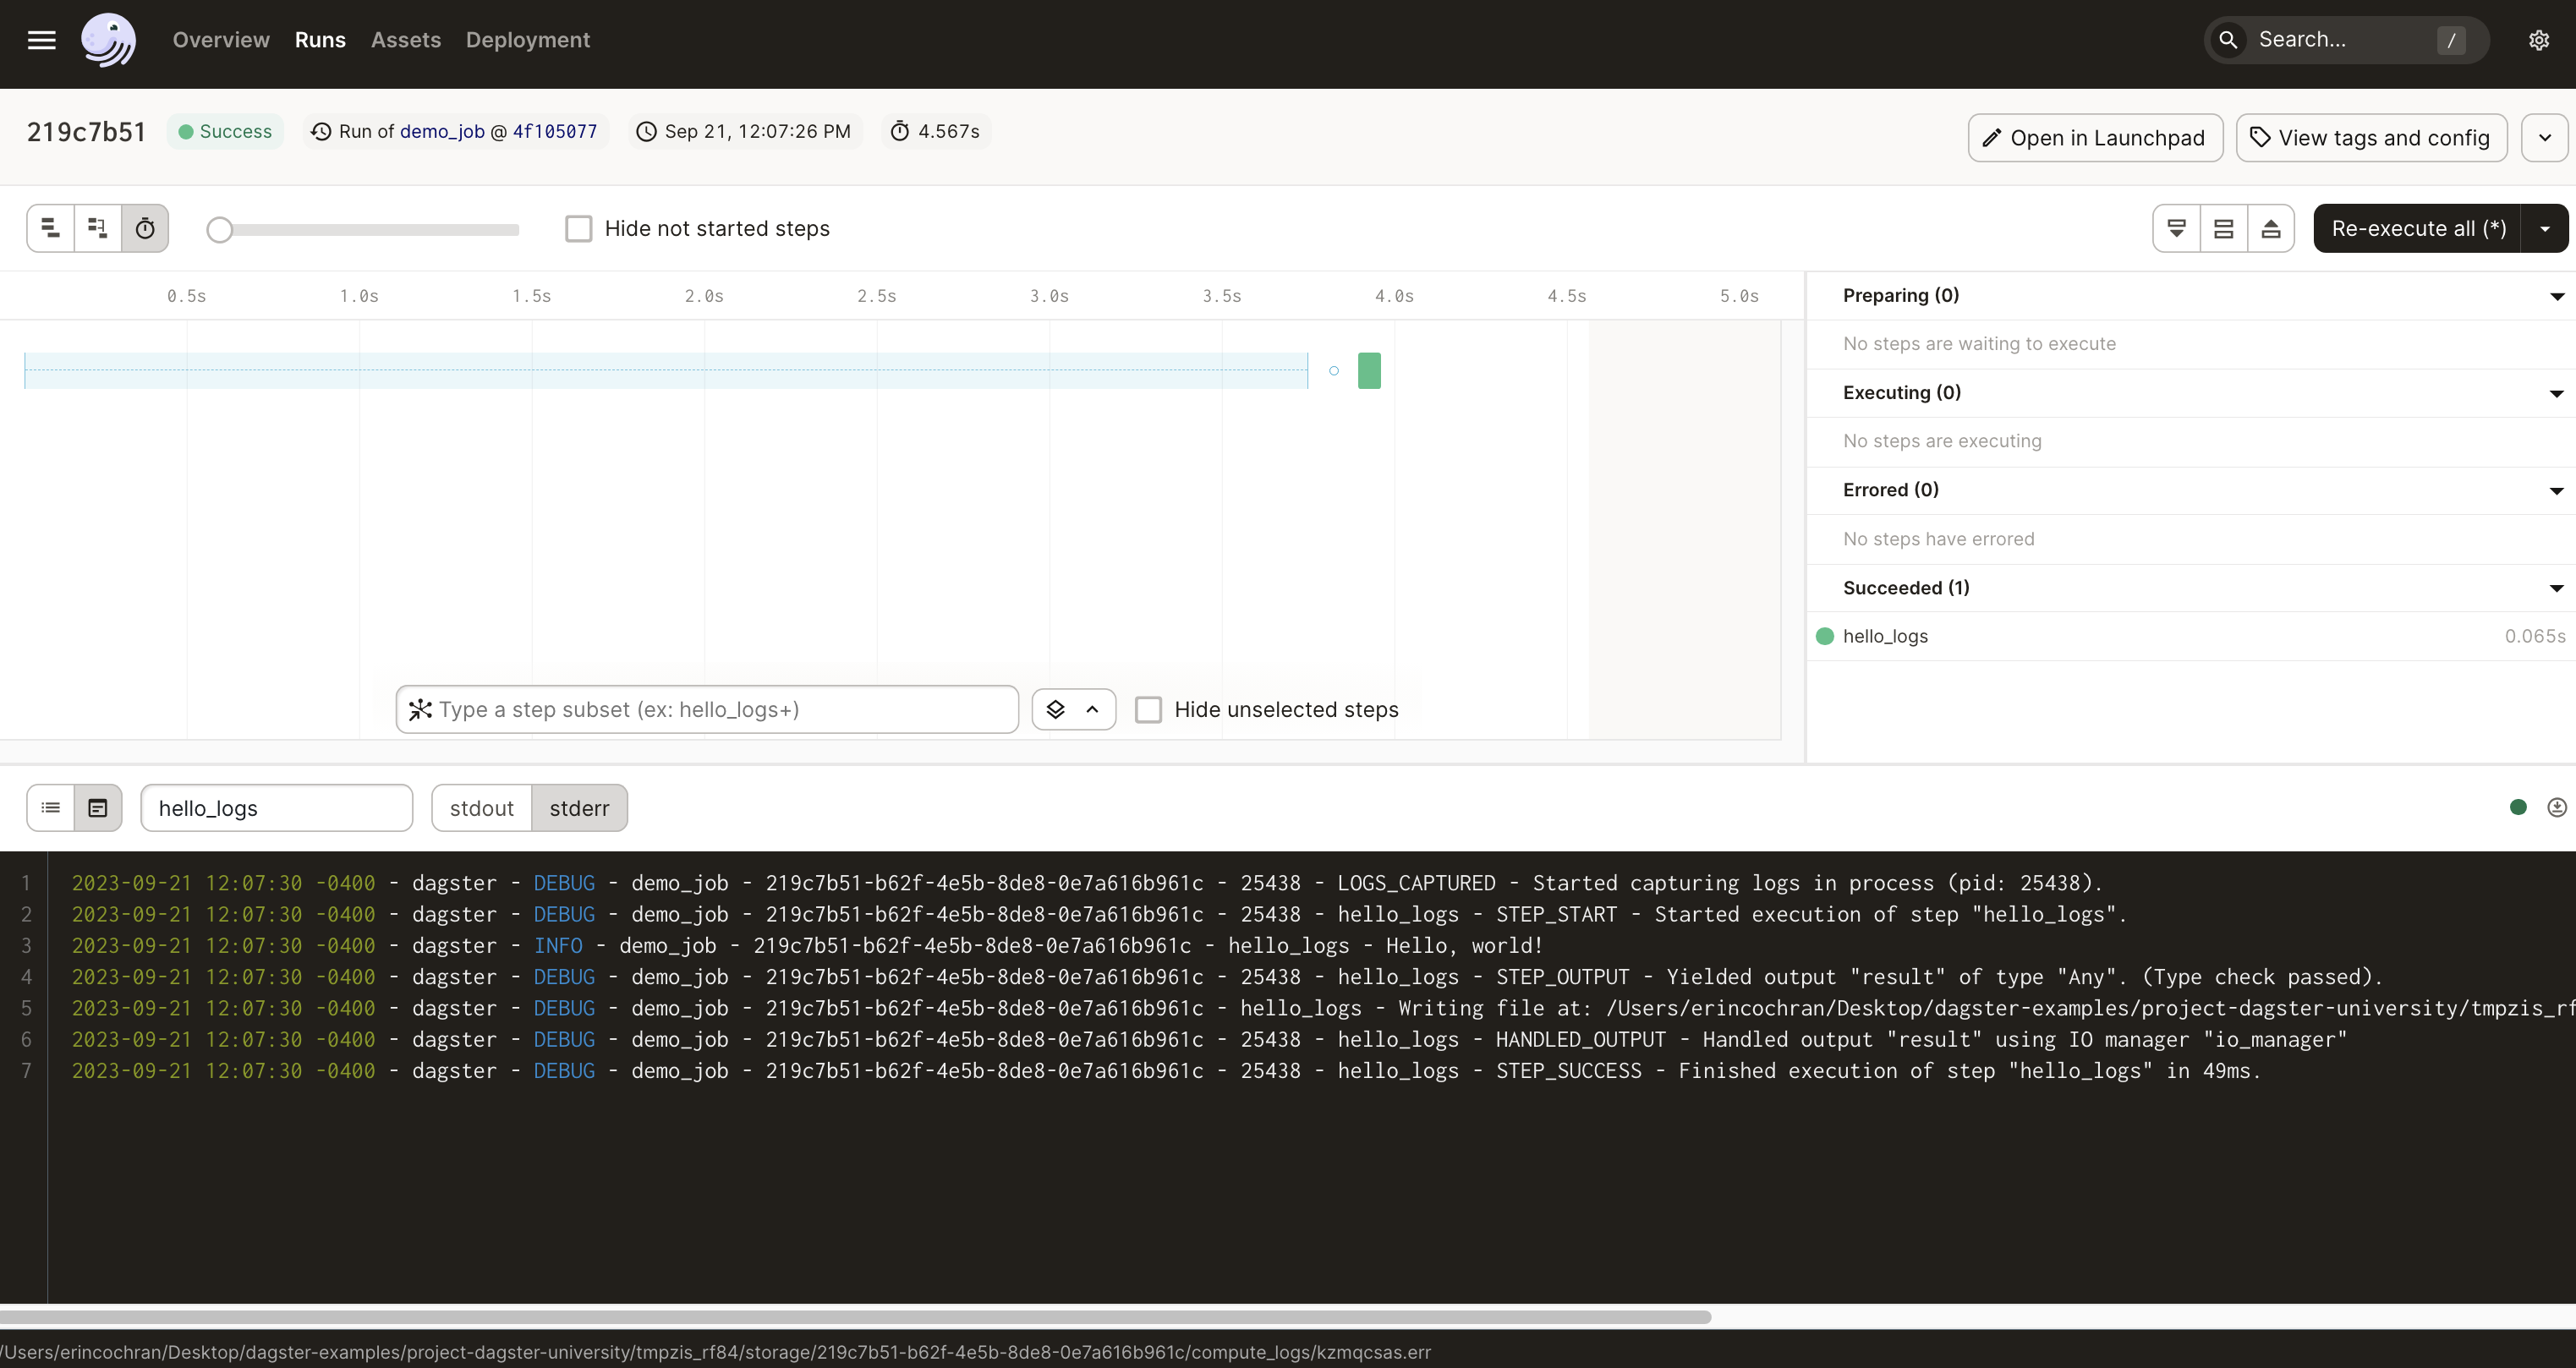
The raw compute logs contain logs for both stdout and stderr, which you can toggle between. To download the logs, click the arrow icon near the top right corner of the logs.
Custom log messages are also included in these logs. Notice in the following image that the Hello world! message is included on line three:

Windows / Azure users may need to enable the environment variable PYTHONLEGACYWINDOWSSTDIO in order for compute logs to be displayed in the Dagster UI. To do that in PowerShell, run $Env:PYTHONLEGACYWINDOWSSTDIO = 1 and then restart the Dagster instance.
Configuring loggers
Loggers can be configured when you run a job. For example, to filter all messages below ERROR out of the colored console logger for a job, add the following lines to the run config in the launchpad or RunRequest:
loggers:
  console:
    config:
      log_level: ERROR
When a job with the above configuration is executed, you'll only see the ERROR level logs.
Customizing Dagster's built-in loggers
Dagster's built-in loggers:
- Support all levels of Python logs, such as
INFO,DEBUG,ERROR, etc. - Can be configured to capture only specified levels, such as
ERROR - Can include manually-defined messages produced inside certain Dagster definitions like assets, ops, and sensors
For more information on customizing loggers, see Customizing Dagster's built-in loggers.
Integrating external loggers
In addition to built-in loggers, you can also integrate external loggers to augment Dagster's default logs. Other options, such as custom handlers and formatters, can be configured in your project's dagster.yaml.
For more information and examples, see the Python logging guide.